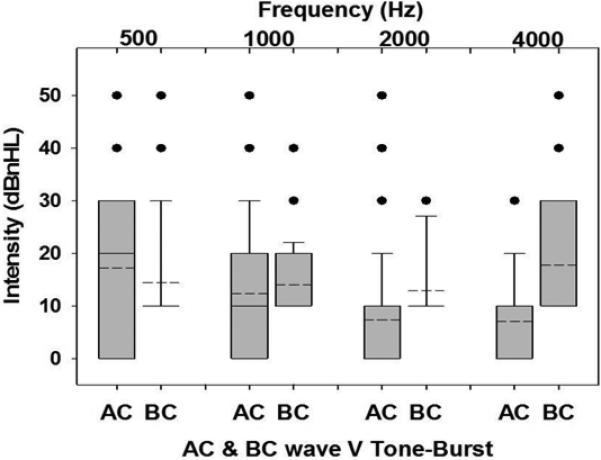
Figure 3.

Box and whisker plots of the mean (dotted lines) and median (solid lines) for AC TBABR thresholds and BC TB-ABR thresholds. The gray bars represent the 25th to 75th percentiles. Whiskers of the plots are the 10th to 90th percentiles. The dots represent outliers. Note that at some frequencies, box and whiskers overlap due to non-normal distribution.
