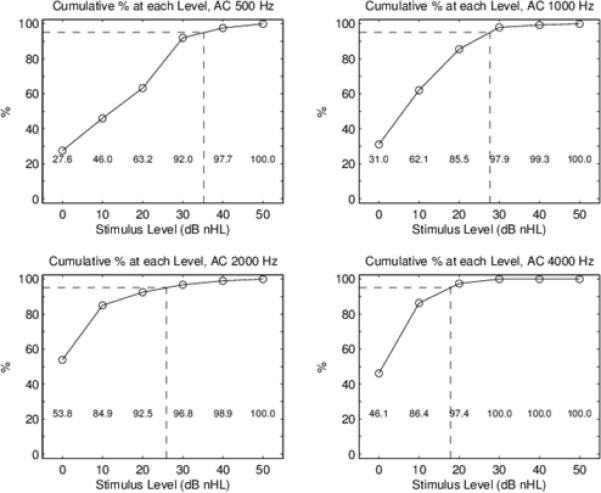
Figure 4.

AC thresholds: Cumulative percentage of thresholds up to and including each stimulus level. This cumulative percentage is normalized by the number of test ears, which varies across the four TB frequencies. The numerical cumulative percent is shown in text at the bottom of each panel. The 95th percentiles are marked by the dotted line at each of the four TB frequencies to the nearest 5 dB.
