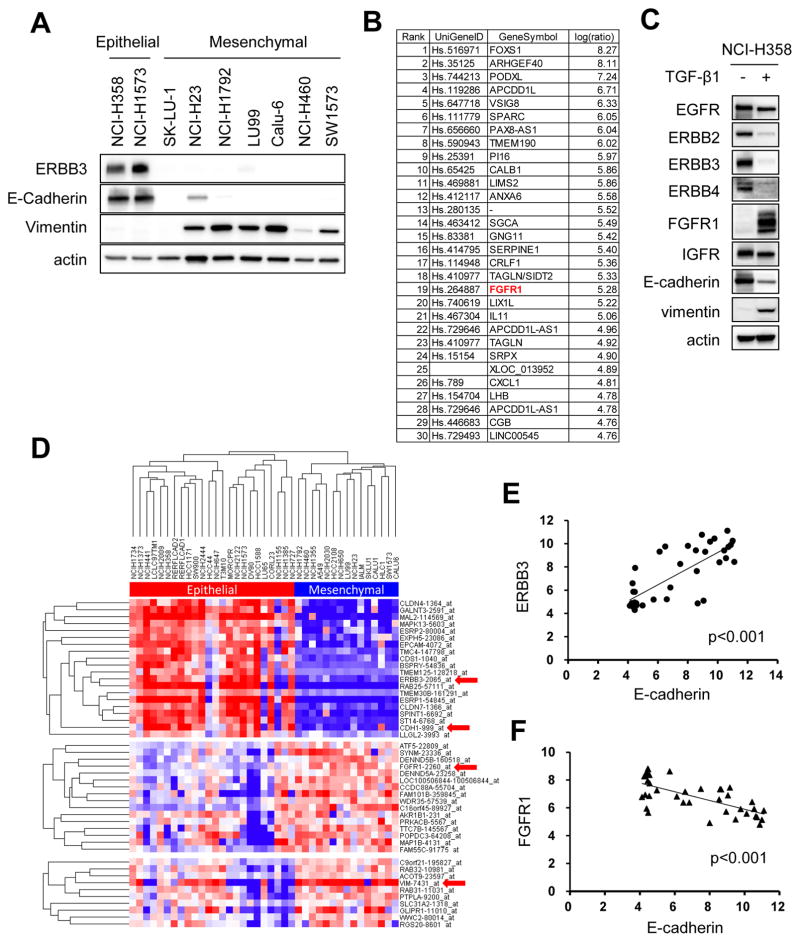
Figure 2. FGFR1 is dominantly expressed in mesenchymal-like KRAS mutant lung cancer cell lines.
(A) Expression of ERBB3, E-Cadherin, and Vimentin protein were analyzed by western blotting of lysates from KRAS mutant lung cancer cell lines. Actin is a loading control. Independent experiments were performed three times, and a representative result is shown. (B, C) NCI-H358 cells were treated with TGF-β1 (4 ng/mL) or PBS for 14 days in order to induce EMT. (B) RNA was extracted from each cells and gene expression profiles were compared. List of 30 genes most upregulated following TGF-β1 treatment was shown. (C) Lysates were extracted from each cells and immunoblotted with antibodies against indicated RTKs and EMT markers. Actin was used as a loading control. Independent experiments were performed three times, and a representative result is shown. (D) Unsupervised hierarchical clustering of 39 KRAS mutant NSCLC cell lines from Cancer Cell Line Encyclopedia (CCLE) database. A total of 2635 genes were analyzed which are showing more than 5-fold change among cell lines with median expression value of 6 or more. (E, F) Scattered plot analysis showing relationship between ERBB3 and E-Cadherin (E) and an inverse relationship between FGFR1 and E-Cadherin (F). p < 0.001, both by linear regression analysis.

