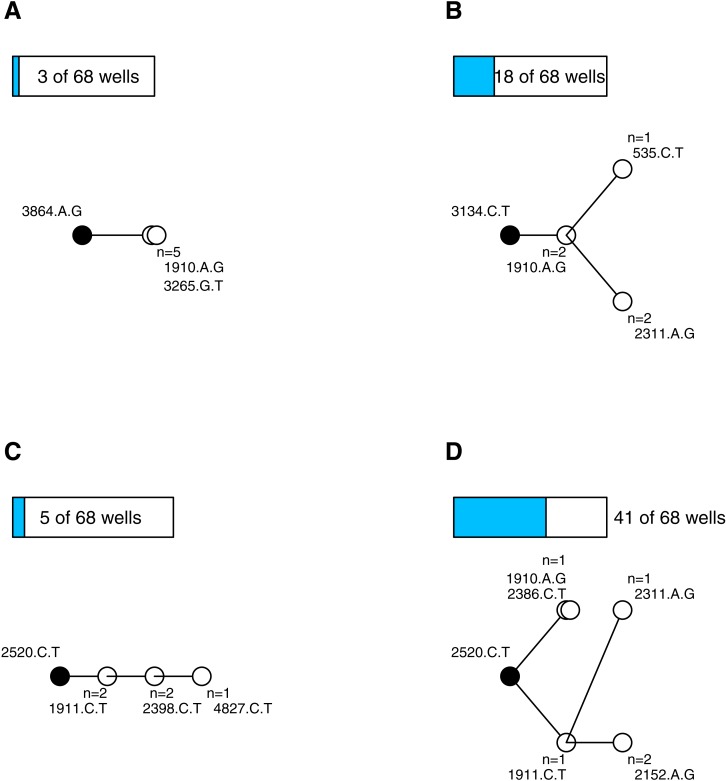
Figure 1. Most wells displayed complex interference dynamics.
Shown are examples of within-well phylogenies corresponding to different types of mutational dynamics and their relative frequencies. Ancestral background mutation is black dot; de novo mutations are white; bars above trees show number of wells with this basic pattern. (A) All isolates fixed for same mutations is consistent with sweep dynamics. (B) Observations confined to single tip mutations and their shared background consistent with the clonal interference model of Gerrish & Lenski (1998). (C) Unbranched tree in an unfixed population is consistent with mutations arising sequentially on the most-fit background. (D) Extended branching tree in an unfixed population indicates competing multi-step lineages. (C–D) Represent complex interference dynamics.

