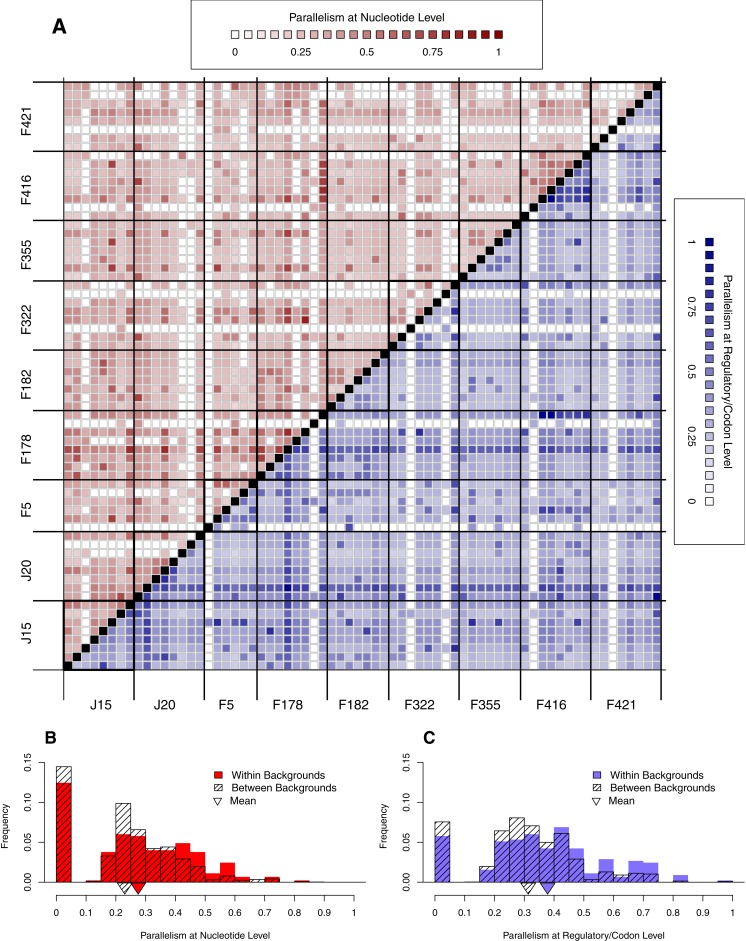
Figure 6. Parallelism within backgrounds is only slightly higher than parallelism between backgrounds.
(A) Parallelism between all pairs of wells from low (light) to high (dark). Above the diagonal in red is parallelism at nucleotide level; below the diagonal in blue is parallelism at the regulatory/codon level. Squares along diagonal are within background comparisons, all others are between backgrounds. Notice that within-background quadrants are not noticeably darker than between-background quadrants. (B–C) Histograms comparing within- vs. between-background parallelism pooled across backgrounds at the nucleotide (B) and regulatory/codon (C) level. The histograms reveal that parallelism is, on average, slightly higher within backgrounds (p < 0.01).

