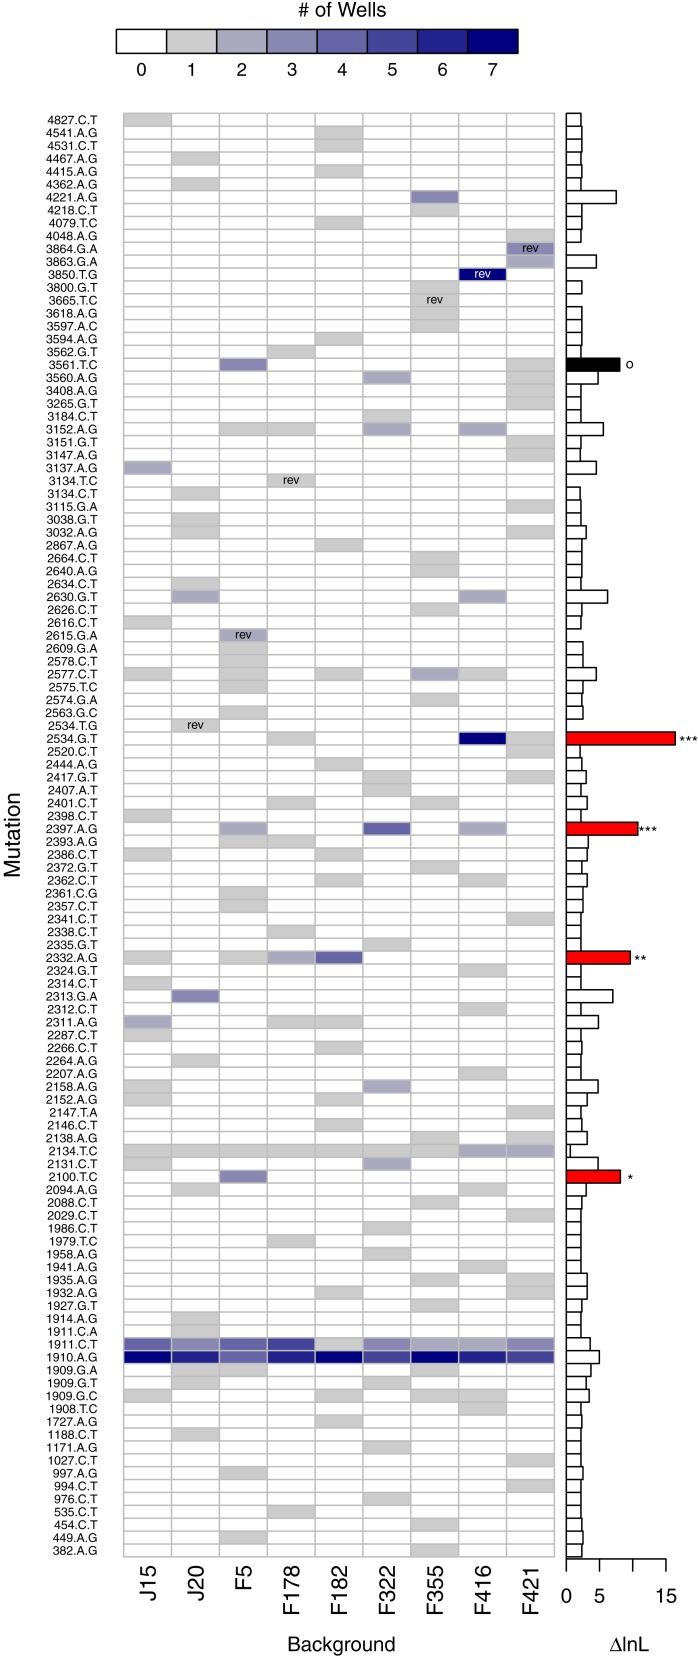
Figure 7. Evidence of background epistasis is significant but rare.
The main plot shows the number of wells each mutation appears in with a heatmap scale above the plot. Within cells, ‘rev’ indicates the mutation is a reversion and is excluded from statistical testing. The barplot to the right gives the difference in log-likelihood (ΔlnL) between the null (no epistasis) and the alterantive (epistasis) model for each mutation. Globally, the no-background effect null is rejected (p < 0.001). To determine which mutations are significant, they were removed from the dataset from the largest downward in a cumulative fashion. Removal of the mutations with red bars still resulted in significant results (∗∗∗p < 0.001, ∗∗p < 0.01, ∗p < 0.05). Removal of the red mutations plus the mutation in black results in a non-significant result (p ≈ 0.104).

