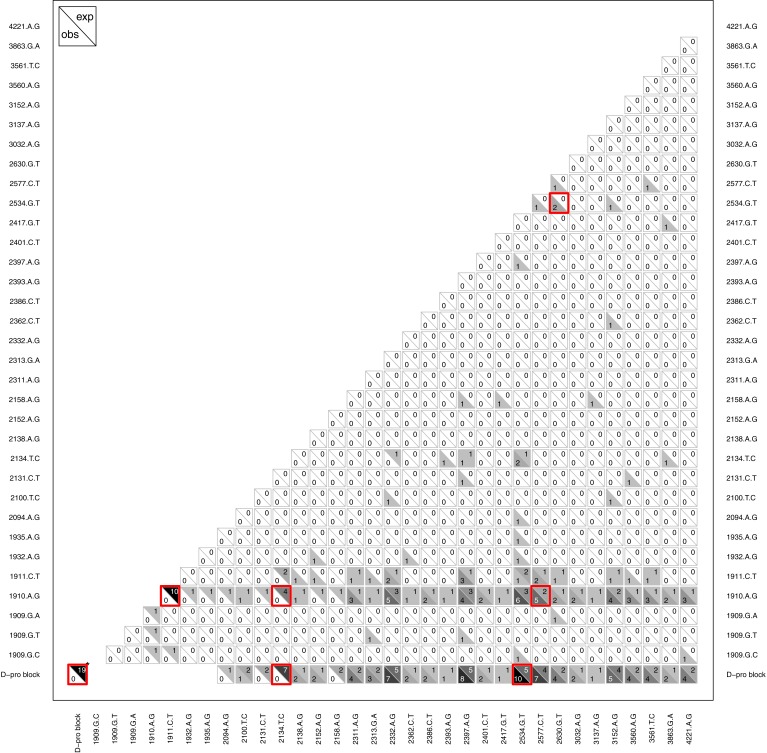
Figure 8. Pattern of observed vs. expected co-occurences.
Most importantly, the plot reveals that D-promoter mutations never co-occur nor do they occur with several other mutations including 2134cT, 2094aG, 2131tC, and 2158aG. Each cell shows the observed count in the lower left vs. the expected count in the upper right for that comparison. Larger counts are shaded more darkly to show the overall pattern and significant differences (p < 0.05) are highlighted in red. The D-promoter mutations are at sites 1909–1935 (first 7 mutations) and the D-pro block is this collection of mutations. *The D-pro block comparison with itself shows the total number of observed and expected wells where two different D-promoter mutations co-occur in the same isolate; all other comparisons with D-pro block are observed and expected co-occurences with any D-promoter mutation. Singletons and reversions have been removed from the figure and expected counts have been rounded to nearest integer. Expected counts are based on a bootstrap randomization procedure (see methods).

