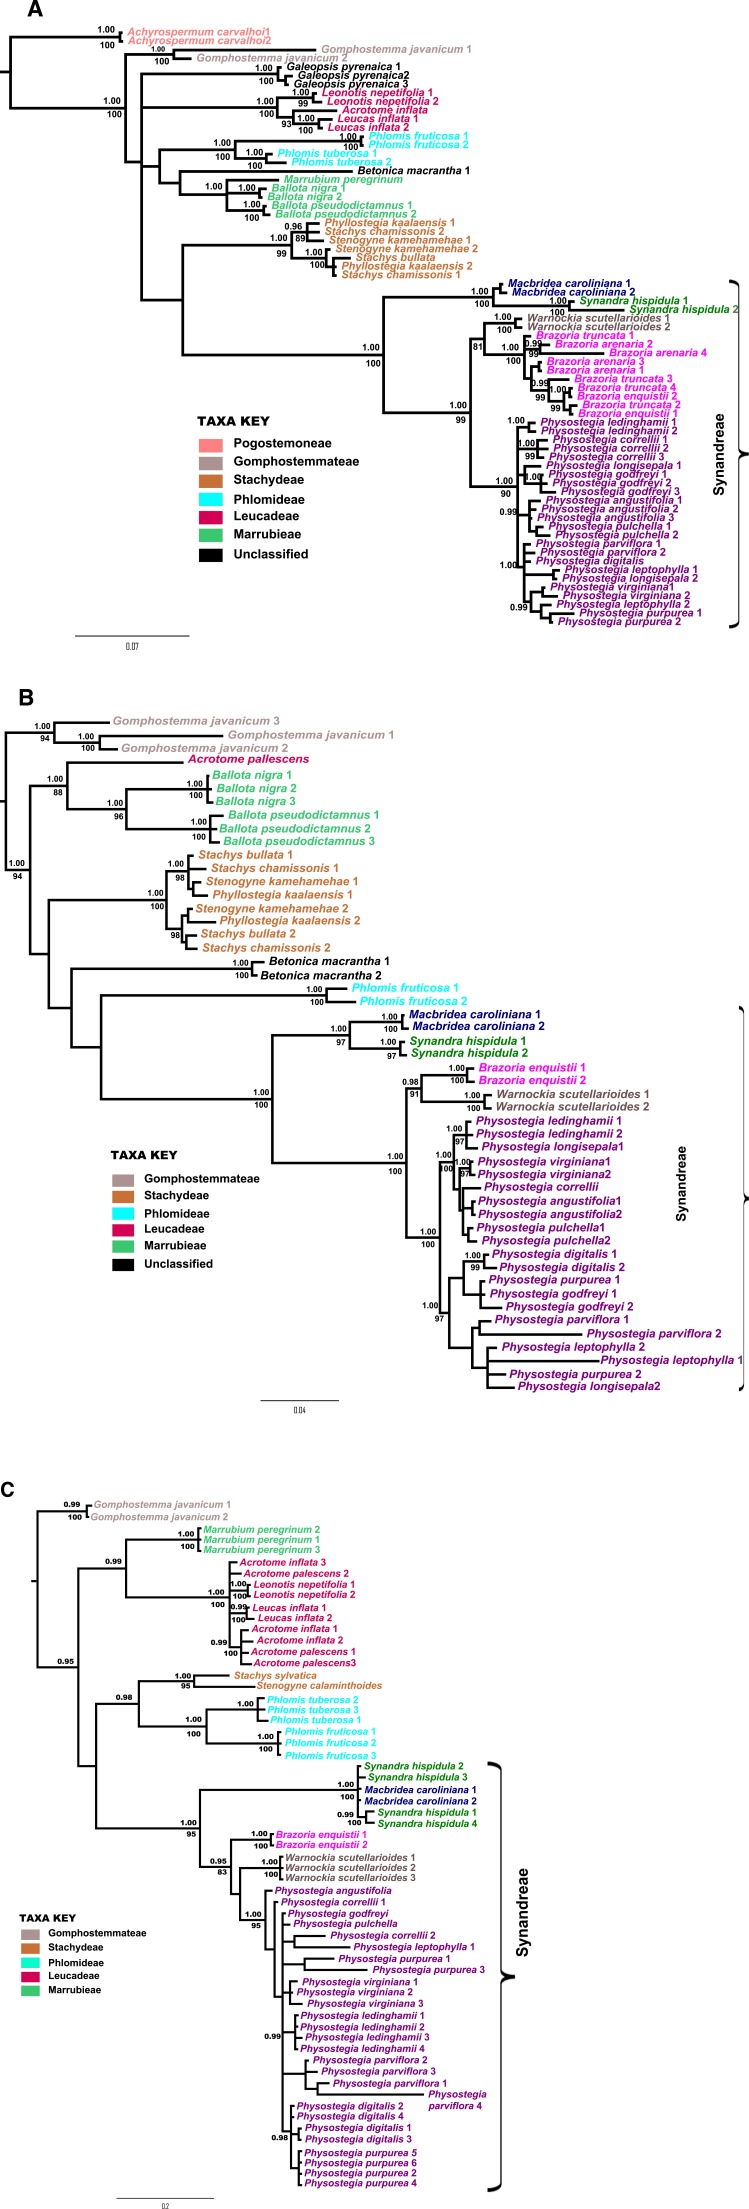
Figure 2. Phylogenetic gene trees.
Bayesian 50% majority rule consensus trees obtained from analyses of (A) PHOT1, (B) PHOT2, and (C) COR, respectively. Bayesian posterior probability values ≥0.95 and maximum likelihood bootstrap support values ≥80 are shown above and below the nodes, respectively. Numbers following taxon names refer to different clones from PCR products.

