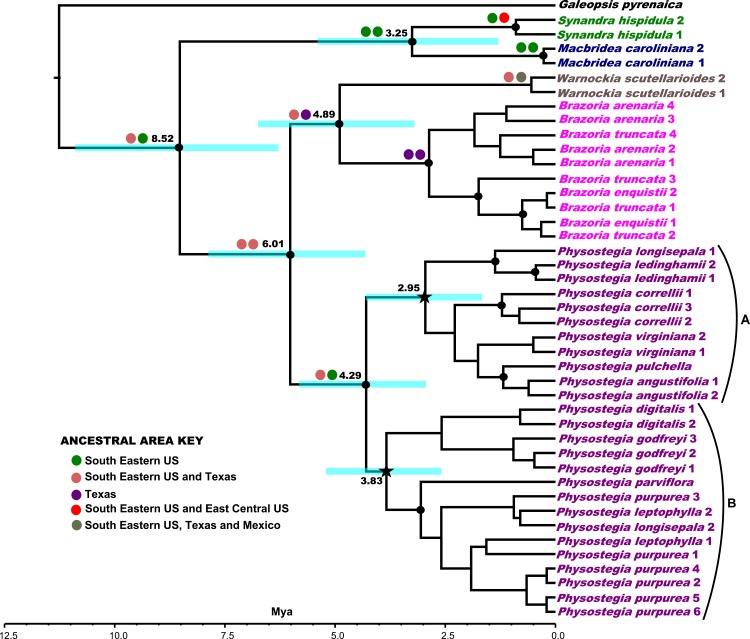
Figure 3. Phylogenetic tree of concatenated nuclear loci.
Bayesian 50% majority rule consensus tree obtained from analyses of the concatenated dataset (COR, PHOT1, PHOT2, and PPR). Nodes supported by Bayesian posterior probability values (PP) ≥ 0.95 and maximum likelihood bootstrap support (BS) ≥ 80 are labeled with black dots. The black stars represent two nodes (clades A and B) discussed in the text, which both have a PP ≥ 0.90 and a BS > 95. Numbers following taxon names refer to different clones sequenced. The ancestral area reconstructions of Synandreae are labeled as circles next to their respective nodes (see ancestral area key), with left circles representing ancestral area reconstructions from S-DIVA and right circles from Lagrange, respectively. The dates from divergence timing analyses of Synandreae are mapped next to the respective nodes (ages are in Million years). A scale bar has been provided for ages in Million years ago (Mya).

