
Fig. 2. Basal stem cells make stochastic fate choices that are temporally coordinated.
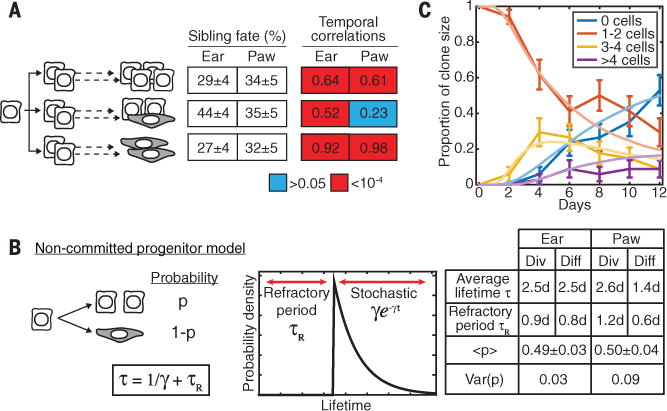
(A) The proportion of divisions leading to symmetric and asymmetric fates, and the magnitude and significance of sister cell lifetime correlations, measured directly from lineage trees (n = 136 divisions across n = 40 trees in the ear, and n =101 divisions across n = 92 trees in the paw). Color shows the statistical significance of correlations: P > 0.05 (blue), P < 10−4 (red). (B) A stochastic model of cell fate, with each cell dividing or directly differentiating after a minimum refractory period, with a fluctuating division probability P balanced at 50% in homeostasis. Spatial or lineage-coupled fluctuations in P between sister cells, measured by the variance in P, lead to correlated sister cell fates. τ, average cell lifetime, γ, stochastic division/differentiation rate after a refractory period. The model is mathematically defined in ST S3. (C) A fit of the model to the distribution of clone sizes (basal cells per clone) over time (n = 40 clones); error bars, SEM.