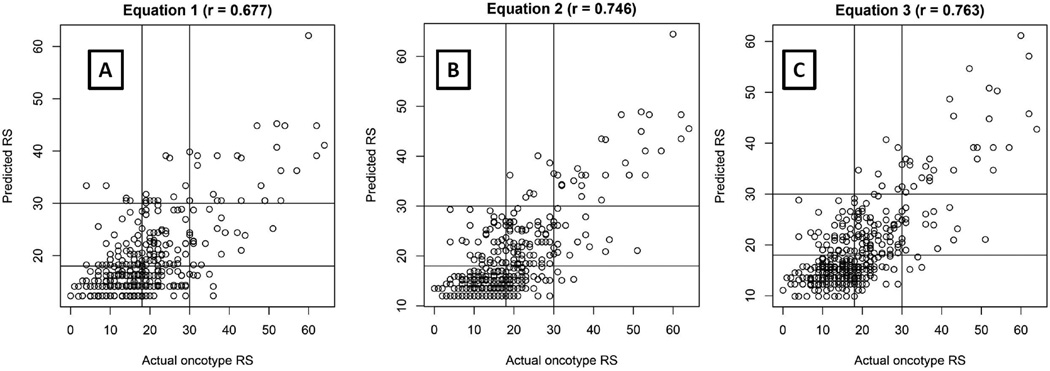
Figure 2.
Graphical representation of scores estimated/predicted by using three different equations [(Y axis) versus actual ORS (X axis)]. Intercepts are drawn at ORS 18 and 30. Equation 1 represents reported Nottingham grade with no other histologic variables; Equation 2 represents current Nottingham grade with no other histologic variables; Equation 3 includes current Nottingham grade with other histologic variables; Note increasing r values.

