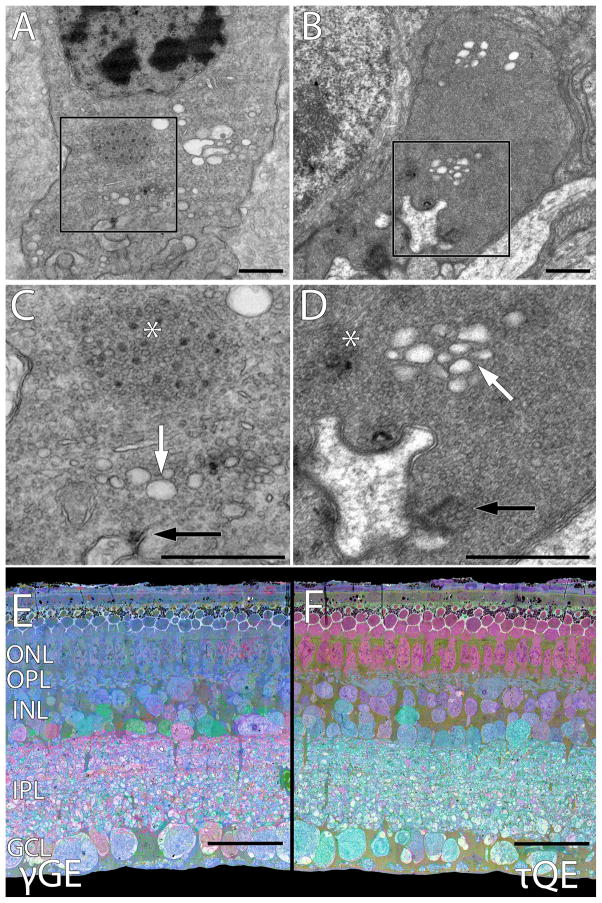
Figure 2. A–D: Transmission electron microscope (TEM) images showing similar cone synapse ultrastructure of the torpid 13LGS and the Tg P347L rabbit. The latter is a model of retinitis pigmentosa. E–F: Computational molecular phenotyping (CMP) of retina from a 13LGS recently emerged from torpor. Small molecule signals have been superimposed onto TEM structural data, quantitatively informing as to cell type and metabolic state.
A. Torpid 13LGS cone terminal with an aggregate of degenerate ribbon structures and synaptic vesicles that has moved ~500 nm away from the remnant active zone ribbon. Scale bar, 500 nm.
B: Tg P347L rabbit cone terminal showing degenerate ribbon structures resembling hibernating squirrel and human RP. Scale bar, 500 nm.
C: Higher magnification view of torpid 13LGS cone terminal (inset box from A) demonstrating an ectopic synaptic cloud (asterisk) and clear vesicles from fragmented Golgi apparatus (white arrow) along with the remnant synaptic ribbon (black arrow). Scale bar, 500 nm.
D: Higher magnification view Tg P347L rabbit cone terminal (inset box from B), demonstrating an ectopic synaptic cloud (asterisk) as well as truncated or remnant synaptic ribbon (black arrow) and the clear fragmented Golgi vesicles (white arrow). Scale bar, 500 nm.
E: CMP overlay mapping of GABA (red), glycine (green), and glutamate (blue) signals. Both excitatory (photoreceptor, bipolar and ganglion cells) and inhibitory retinal neurons (amacrine cells) can be visualized. Scale bar, 30 μm.
F: CMP overlay mapping of taurine (red), glutamine (green), and glutamate (blue) signals. Alternate mapping of the same specimen in E demonstrates Müller cells alongside excitatory and inhibitory cell classes. Scale bar, 30 μm.

