
Figure 13.
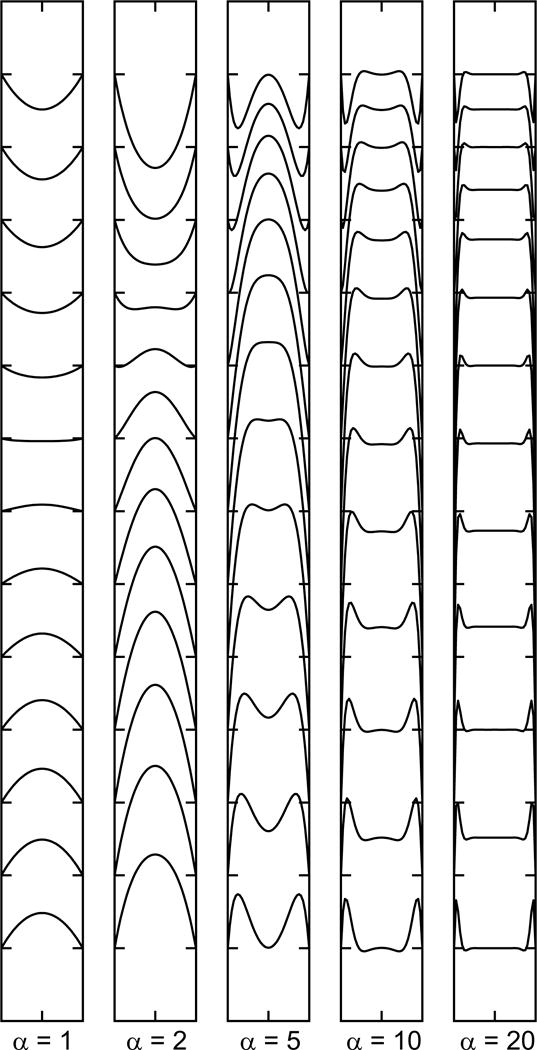
Sequences of velocity profiles in a tube with a sinusoidally varying pressure gradient, for indicated values of unsteadiness parameter α. Velocity profiles represent one half of a complete cycle of the oscillation. Bottom profile corresponds to moment of maximum pressure gradient.