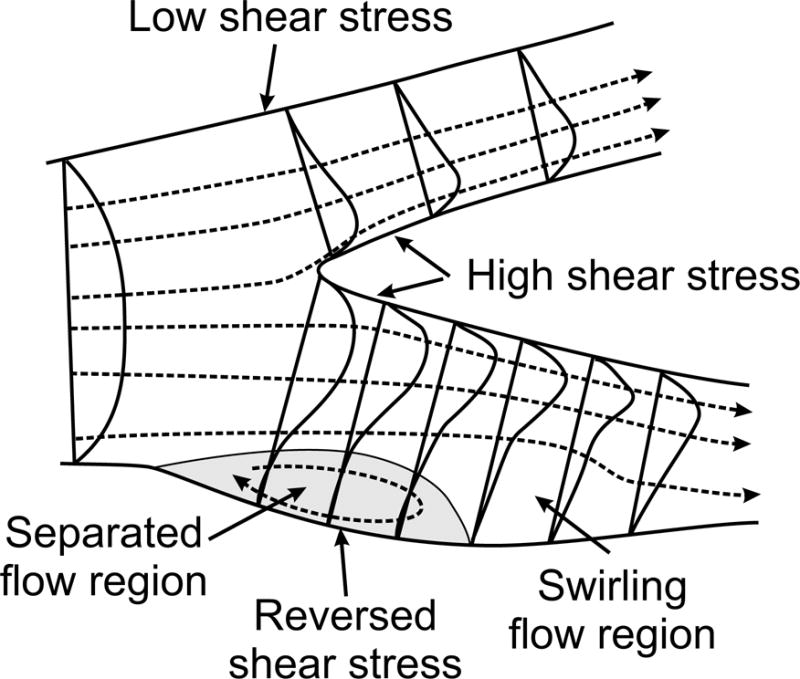
Figure 15.

Sketch of flow phenomena occurring during steady flow in a human carotid artery bifurcation, based on observations in a transparent postmortem sample (68). Dashed lines indicate fluid streamlines. Curves across vessel diameters indicate local velocity profiles. Shaded area indicates region of flow separation, with separation point at the upstream end and reattachment point at the downstream end.
