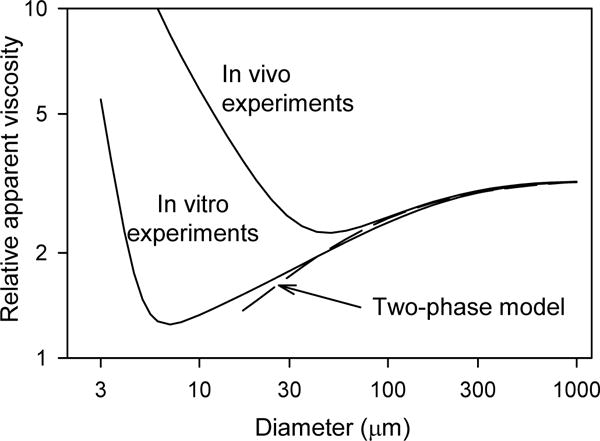
Figure 17.

Variation of apparent viscosity with tube diameter for hematocrit HD = 0.45. The lower solid curve represents an empirical fit to experimental in-vitro data (77). The upper solid curve represents the dependence deduced from in-vivo experiments (87). The dashed curve corresponds to a two-phase model with cell-free layer width 1.8 μm, as discussed in the text.
