
FIG 1.
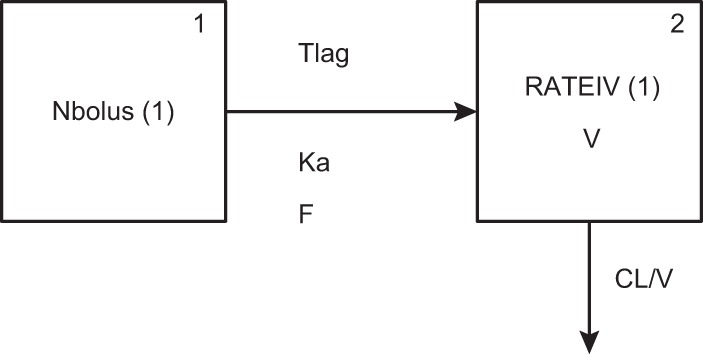
Illustration of the structural model, where compartment 1 represents the gut for oral administration and compartment 2 represents the central compartment. CL, clearance; F, bioavailability; Ka, first-order absorption rate constant; Tlag, lag time; V, volume in the central compartment.