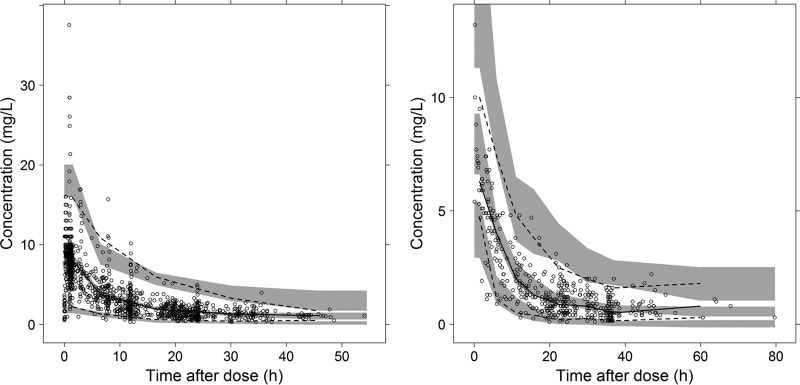
FIG 2.
Visual predictive check of 1,000 simulated concentration-time data sets from the final model, using the model-building data set (left) and the evaluation data set (right). Points represent the observations, black lines represent the 2.5th, 50th, and 97.5th percentiles, and the shaded areas represent the 95% confidence intervals of the corresponding predicted gentamicin concentrations.

