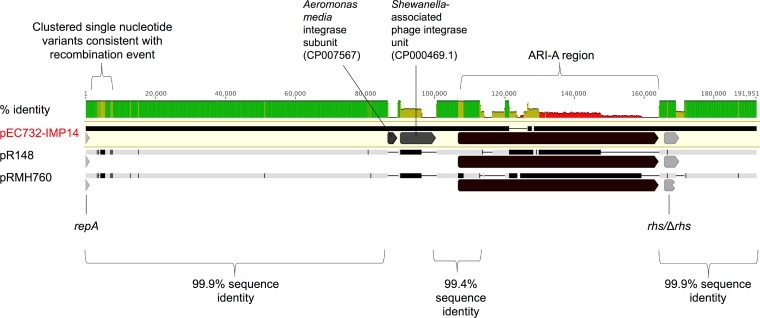
FIG 2.
Alignment of pEC732-IMP14, pR148, and pRMH760 demonstrating mean percent pairwise identity over alignment columns (green, 100%; olive, 30 to 70%; red <30%; no color, 0%). Vertical black lines in the sequence bars represent differences between the nucleotide sequences with respect to the pEC732-IMP14 reference; thin horizontal black lines represent deleted regions. The repA gene, variable ARI-A resistance region, and rhs gene are indicated, as are the region of clustered single-nucleotide variants downstream of the repA region and two additional mobile genetic elements present in pEC732-IMP14 and absent from the other two sequences.

