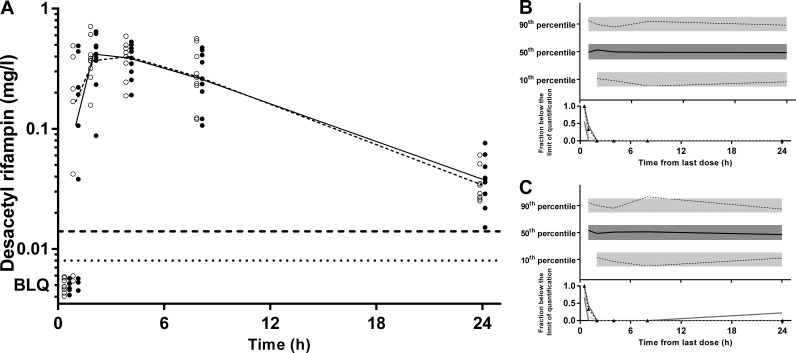
FIG 10.
(A) Time-concentration profile of desacetyl rifampin (milligrams per liter) for dried blood spot-derived (open circles and dashed line) and measured (closed circles and solid line) plasma concentrations (data points are artificially separated to aid comparison). (B and C) Normalized VPC for dried blood spot (B) and plasma (C) concentrations demonstrating the 10th, 50th, and 90th percentiles with the actual data (solid and dashed lines) within their respective 95% prediction intervals (gray-shaded areas).

