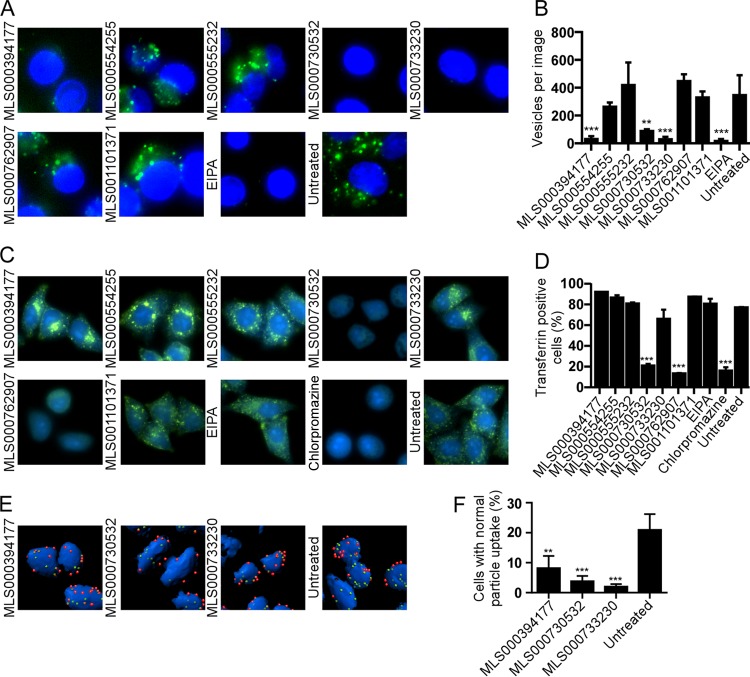
FIG 3.
Effect of compound treatment on macropinocytosis and uptake of EBOV into cells. (A) HeLa cells pretreated with 50 μM of the indicated compounds for 1 h, followed by incubation with fluorescently labeled dextran (molecular weight, 10,000; green) as a marker of macropinocytic uptake. Images of cells were captured, and the number of dextran-positive vesicles was counted. EIPA, a known inhibitor of macropinocytosis, was used to block uptake. The cell nucleus (intense blue) and cytoplasm (weak blue) were stained with CellMask blue. (B) The average number of vesicles per cell ± SD was determined for images of at least 50 cells. (C) Measurement of transferrin uptake. HeLa cells were serum starved for 4 h, followed by treatment with the indicated compounds for 1 h in serum-free medium. Treated cells were incubated with 25 μg/ml of transferrin conjugated to Alexa Fluor 488, unbound transferrin was washed off, and the cells were fixed in formalin. Fixed cells were imaged. (D) The fluorescence intensity of the cells after excitation at 488 nm was measured. The fluorescence of cells without transferrin treatment was used to determine the background signal. The percentage of transferrin-positive cells for each treatment was plotted. EIPA (25 μM), a specific inhibitor of macropinocytosis, and chlorpromazine (25 μM), an inhibitor of clathrin-mediated endocytosis and a known inhibitor of transferrin uptake, were used as controls. All data are represented as the means ± SDs for 3 replicates. (E) Cells were incubated with EBOV for 2.5 h in the presence of each of the indicated compounds, and then nonpermeabilized cells were stained for EBOV GP followed by staining with an Alexa Fluor 546-labeled secondary antibody (red). Cells were then permeabilized and the staining was repeated but an Alexa Fluor 488-labeled secondary antibody was used. Cell bodies (blue) were stained with CellMask blue. (F) Deconvolved image stacks were used to generate 3D models of cells with bound virus particles using Imaris software. Internalized virus particles (green, not red) and cell numbers were counted. The number of cells with 15 ± 5 virus particles (mean ± SD for the control) inside the cell cytoplasm was calculated as a measure of virus uptake efficiency. The average ± SD for more than 200 cells is shown. All assays were performed 3 times with similar outcomes. **, P < 0.01; ***, P < 0.001.

