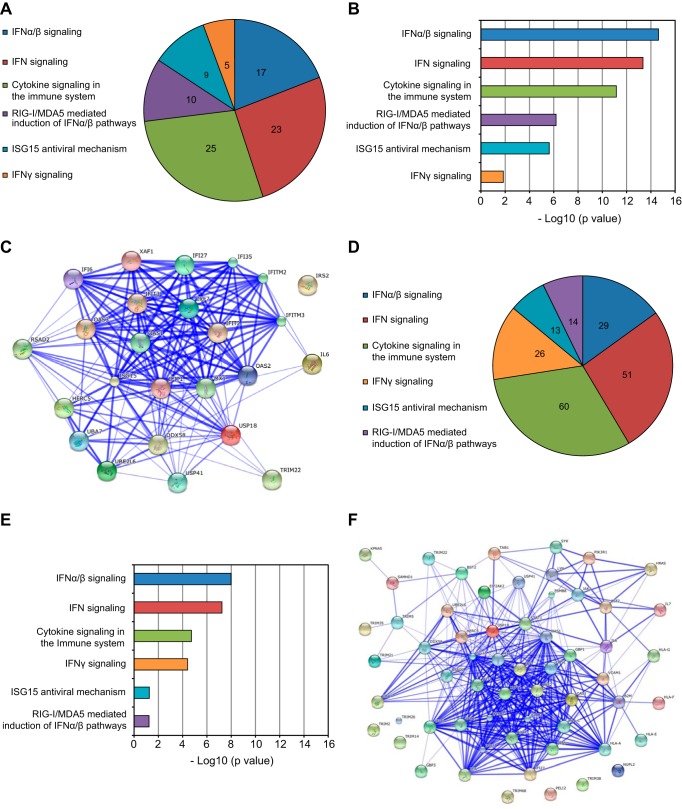
FIG 3 .
Interferon-stimulated genes are upregulated in JCPyV-infected HRPTE cells compared to BKPyV-infected cells starting at 6 days postinfection. HRPTE cells were infected with either JCPyV or BKPyV, and at 3, 6, and 9 dpi, total RNA was harvested and RNA-seq and bioinformatics analyses were performed. Genes from JCPyV-infected cells were compared with those from BKPyV-infected cells. The lists of genes were uploaded to a gene enrichment analysis tool called Enrichr. Pie charts of the top 6 biological pathways were generated with the number of genes assigned by Enrichr to each pathway at 6 dpi (A) and at 9 dpi (D). Enrichr provided P values using Fisher’s exact test, and −log10 (P values) are displayed for the top 6 biological pathways at 6 dpi (B) and 9 dpi (E). The interactions among genes that were assigned to the biological pathway “cytokine signaling in the immune system” were visualized using STRING10 at 6 dpi (C) and at 9 dpi (F); stronger associations are represented by thicker lines.

