FIG 3 .
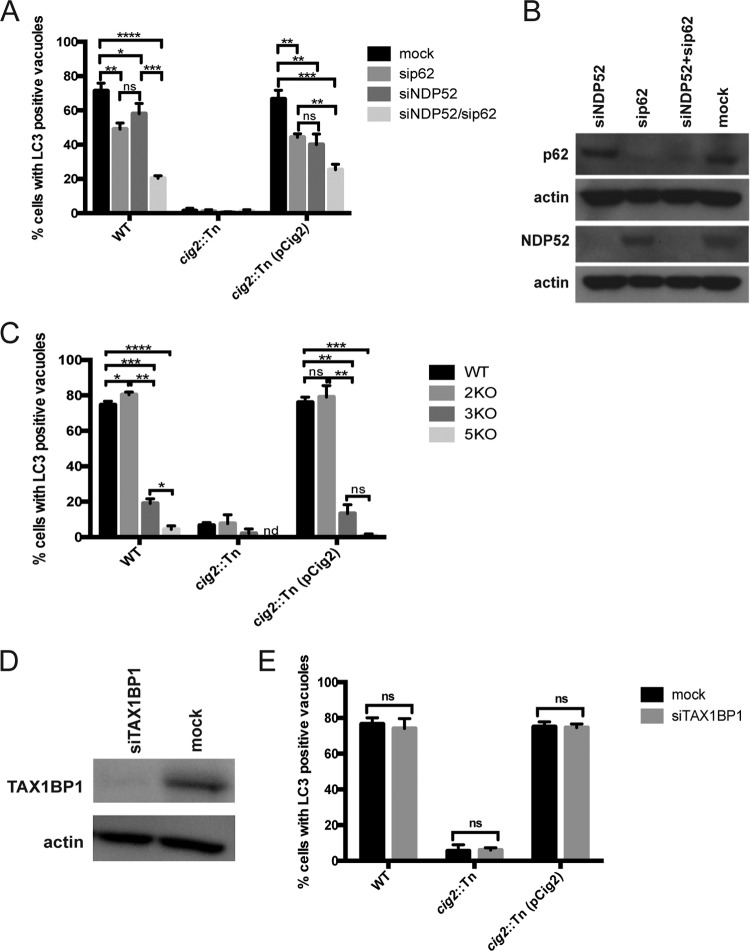
Autophagy receptors accumulate in the CCV. (A) The shading of the bars indicates the autophagy receptors that were silenced before the HeLa cells were infected for 3 days with the strains of C. burnetii indicated on the x axis. The percentage of infected cells with vacuoles that stained positive for LC3 was determined by fluorescence microscopy. (B) Immunoblot analysis of HeLa cell lysates generated 5 days after transfection of the indicated siRNAs (top labels) shows the levels of depletion of the indicated proteins (left labels). (C) The shading of the bars indicates the HeLa cell line in which genes encoding autophagy receptors were mutated by CRISPR/Cas9 targeting (WT, parental HeLa cells; 2KO, cell deficient in OPTN and NDP52; 3KO, cells deficient in OPTN, NDP52, and TAX1BP1; 5KO, cells deficient in OPTN, NDP52, TAX1BP1, NBR1, and p62). HeLa cells were infected for 5 days with the strains of C. burnetii indicated on the x axis. The percentage of infected cells with vacuoles that stained positive for LC3 was determined by fluorescence microscopy using an anti-LC3 antibody. The bar graphs in panels A and C depict the means of the results of three biological replicates within the same experiment ± SD. (D) Immunoblot analysis of HeLa cell lysates generated 5 days after transfection with the indicated siRNAs shows depletion of TAX1BP1. (E) Comparison of LC3-positive vacuoles as determined by immunofluorescence microscopy using antibody against endogenous LC3. TAX1BP1 was silenced with siRNA for 2 days, and then cells were infected with the indicated C. burnetii strains for 3 days before fixation. Data are representative of the results of two independent experiments. The unpaired t test was used to calculate significant differences between samples. ****, P < 0.0001; ***, P < 0.001; **, P < 0.01; *, P < 0.05).

