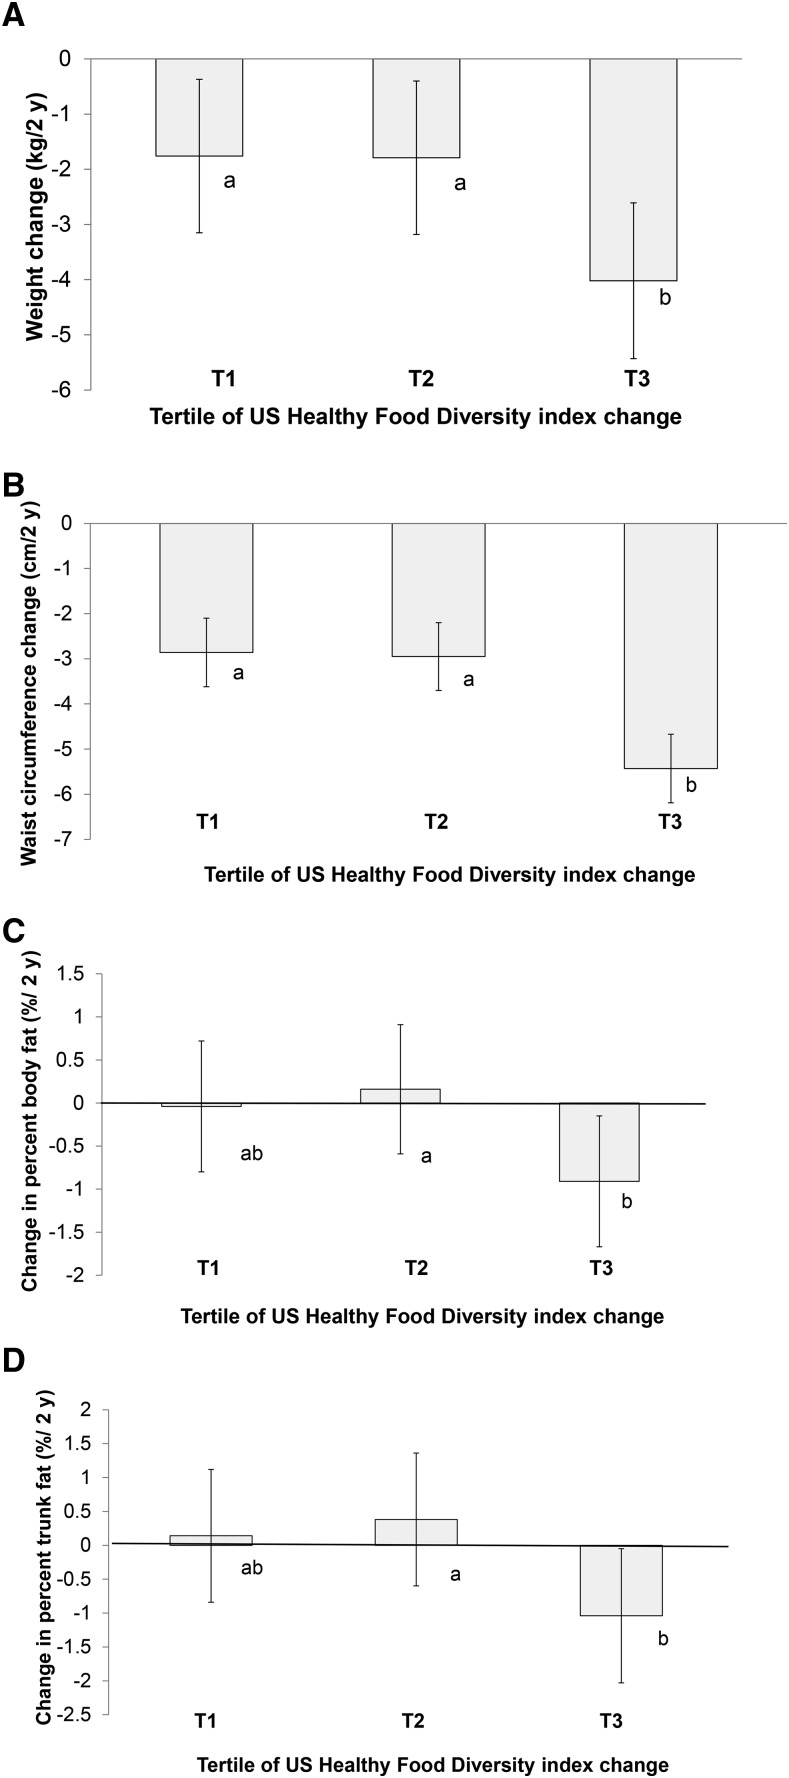
FIGURE 2.
Repeated-measures mean differences in body weight (A), waist circumference (B), percentage of body fat (C), and percentage of trunk fat (D) from baseline to 2 y by tertiles of 6-mo changes in the US Healthy Food Diversity index among POUNDS Lost participants with overweight and obesity. Data are presented as adjusted means with standard errors. Mean changes are adjusted for age, sex, diet arm, time, the interaction between the variety index and time, smoking (current or ever smoker compared with nonsmoker), race (white compared with nonwhite), educational attainment (college graduate compared with some college or high school graduate), household income [low (<$50,000), medium ($50,000–100,000), or high income (>$100,000)], change in physical activity score (0–6 mo), adherence to energy goals at 6 mo, and baseline adiposity indicator (i.e., body weight, waist circumference, total percentage of body fat, or total percentage of trunk fat). Changes in dietary variety were categorized into the following tertiles: T1 (−0.21 to −0.05), T2 (−0.04 to 0.01), and T3 (0.01–0.17). Tukey adjustment was used for all post-hoc comparisons between T1, T2, and T3. The value next to each bar represents the change in adiposity parameter for the corresponding tertile. Labeled means without a common letter differ. There are ∼119 participants in each tertile. POUNDS Lost, Preventing Overweight Using Novel Dietary Strategies; T1, reduced dietary variety; T2, stable dietary variety; T3, increased dietary variety.

