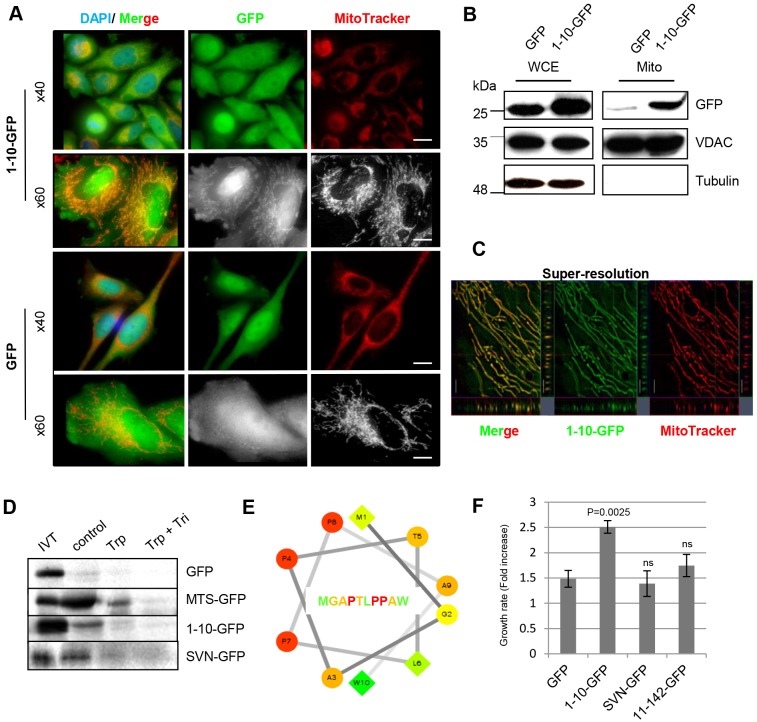
Fig. 2.
The first ten amino acids of survivin are an MTS. (A) HeLa cells expressing survivin1–10–GFP (1-10-GFP) or GFP (green) were grown on poly-L-lysine-coated slides, stained with MitoTracker (red) and imaged live. Scale bars: 20 µm (upper) and 5 µm (lower). (B) Immunoblot of fractionated cells: 25 µg each of whole-cell extracts (WCE) and the cytoplasmic fraction (cyto), and 8 µg of the mitochondrial fraction (mito). Anti-GFP antibody detects GFP and survivin1–10–GFP, and anti-VDAC and anti-tubulin antibodies highlight mitochondrial and cytoplasmic fractions, respectively. (C) Structured illumination of mitochondria in live cells expressing survivin1–10–GFP stained with MitoTracker. Scale bar: 1 µm. (D) Mitochondrial import assay: GFP, MTS–GFP, survivin1–10–GFP and survivin–GFP translated in vitro (IVT), labelled with [35S]methionine then incubated with mitochondria isolated from HeLa cells for 1 h at 37°C. Mitochondria were washed in isolation buffer (control) or treated with 150 µg/ml trypsin (trp) or trypsin and 1% Triton X-100 (tri). Mitochondrial retention of proteins was assessed by SDS-PAGE and phosphor-imaging. (E) Hydropathy wheel plot of the first ten residues of survivin. Residue type: circles, hydrophilic; diamonds, hydrophobic. Hydrophobicity scale is green (high) to yellow (zero). Hydrophilicity scale is red (high) to orange (low). (F) The rate of cell growth of each line was compared in exponential phase. Mean±s.d. of three independent experiments is shown. A paired t-test demonstrated that the increased growth rate of 1-10-GFP cells is significantly different from the GFP control, variance in other lines was not significant (ns). 11-42-GFP, survivin11–142–GFP; SVN-GFP, survivin–GFP.

