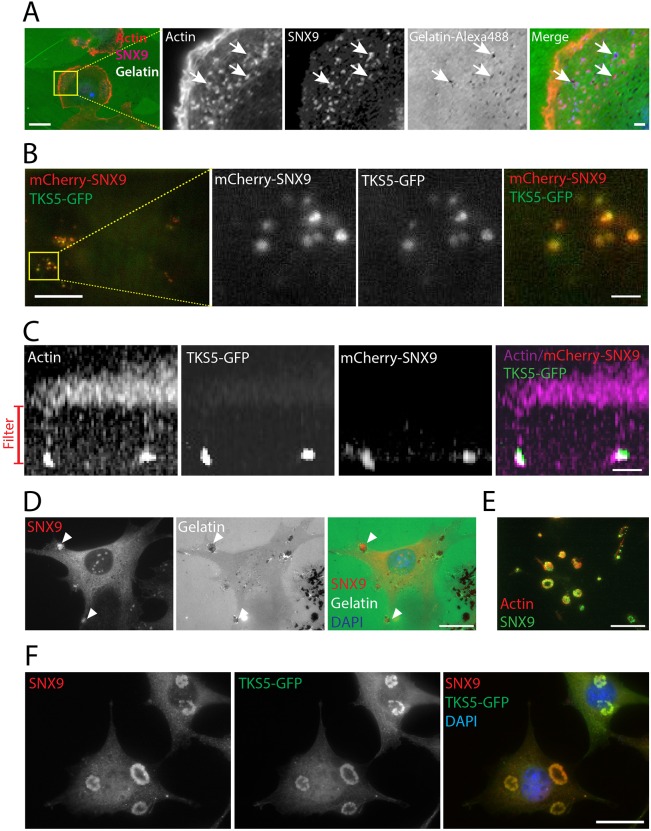
Fig. 2.
SNX9 is localized to invadopodia and podosomes. (A) Staining of F-actin (phalloidin, in red) and endogenous SNX9 (purple) in MDA-MB-231 cells plated on green fluorescent gelatin. Arrows indicate colocalization of SNX9 with actin at dark areas corresponding to matrix degradation at invadopodia. (B) TIRF microscopy image of invadopodia of MDA-MB-231 cells transiently co-expressing mCherry–SNX9 and TKS5–GFP. Insets in A and B show enlargement of yellow boxes. Scale bars: 10 μm, insets 2 μm. (C) Cells expressing mCherry–SNX9 and TKS5–GFP, plated on a filter containing 1-μm-diameter pores, were stained with phalloidin (purple). Image shows a z-stack of confocal sections of invadopodia extending in through the filter. (D) Staining of endogenous SNX9 (red) in NIH-Src cells plated on green fluorescent gelatin. Arrowheads indicate colocalization of SNX9 where matrix has been degraded at podosomes. (E) TIRF microscopy image showing the colocalization of endogenous SNX9 (green) with actin (red) at podosomes on the ventral plasma membrane. (F) Staining of endogenous SNX9 (red) in NIH-Src cells transiently expressing TKS5–GFP. Scale bars: 10 μm, insets 2 μm in A; 10 μm in C–F.

