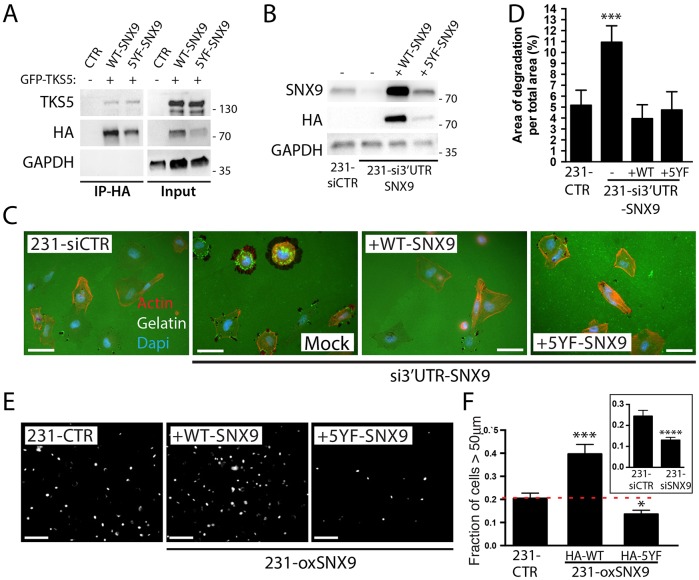
Fig. 7.
Src phosphorylation differentially regulates SNX9 functions. (A) HA pulldown assay of HA–WT-SNX9 or HA–5YF-SNX9 transiently expressed with TKS5–GFP in MDA-MB-231 cells. (B) Western blot analysis of SNX9 expression after SNX9 depletion and rescue with HA–WT-SNX9 or HA–5YF-SNX9. GAPDH was used as loading control in A,B. (C,D) Cells depleted of endogenous SNX9 using a siRNA against its 3′UTR were either transfected with HA–WT-SNX9 or HA–5YF-SNX9, and plated on green fluorescent gelatin. F-actin was subsequently stained using red phalloidin (C) and matrix degradation areas quantified (D). (E) 231-CTR or 231-oxSNX9 cells expressing either WT-SNX9 or 5YF-SNX9 were used in an inverted 3D cell invasion assay through a collagen I matrix. Cell nuclei were stained and images were taken every 25 μm. Figure shows Hoechst staining, showing nuclei distribution at 50 μm, from a representative experiment. (F) Quantification of nuclei distribution in the inverted invasion assay described in E. Inset shows invasion ratio of 231-siSNX9 versus 231-siCTR, confirming previous results (Bendris et al., 2016). n=3; *P≤0.05, ***P<0.005, ****P<0.0001. Results on bar charts are presented as mean±s.e.m. Statistical significance was evaluated using one-tailed Mann–Whitney test. Scale bars: 20 μm in C, 25 μm in F.

