Fig. 3.
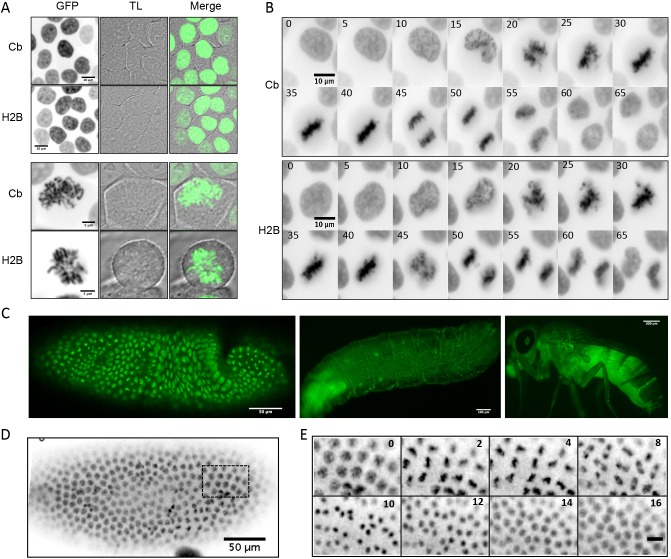
Chromatibody–GFP fusion expressed in living cells. (A) Confocal images of HCT116 cells expressing chromatibody (Cb)–GFP or H2B–GFP at interphase (upper panels, scale bars: 10 µm) or mitosis (lower panels, scale bars: 5 µm). Left, middle and right panels show the GFP fluorescence (inverted gray scale), transmitted light (TL) and merged signals, respectively. (B) Time-lapse fluorescence imaging (inverted gray scale) of HCT116 cells stably expressing the chromatibody–GFP or H2B–GFP. The time sequence is indicated in minutes. (C) Confocal imaging of a Drosophila blastoderm (scale bar: 50 µm), living larvae (scale bar: 100 µm) and adult (scale bar: 300 µm) expressing the chromatibody–GFP under the control of the tubulin promoter. (D) Fluorescence image (inverted gray scale) of a living Drosophila embryo expressing chromatibody–GFP. (E) Higher magnification and time-lapse fluorescence microscopy of the embryo shown in D. Scale bar: 10 µm. The time sequence is indicated in minutes.

