
Fig. 4.
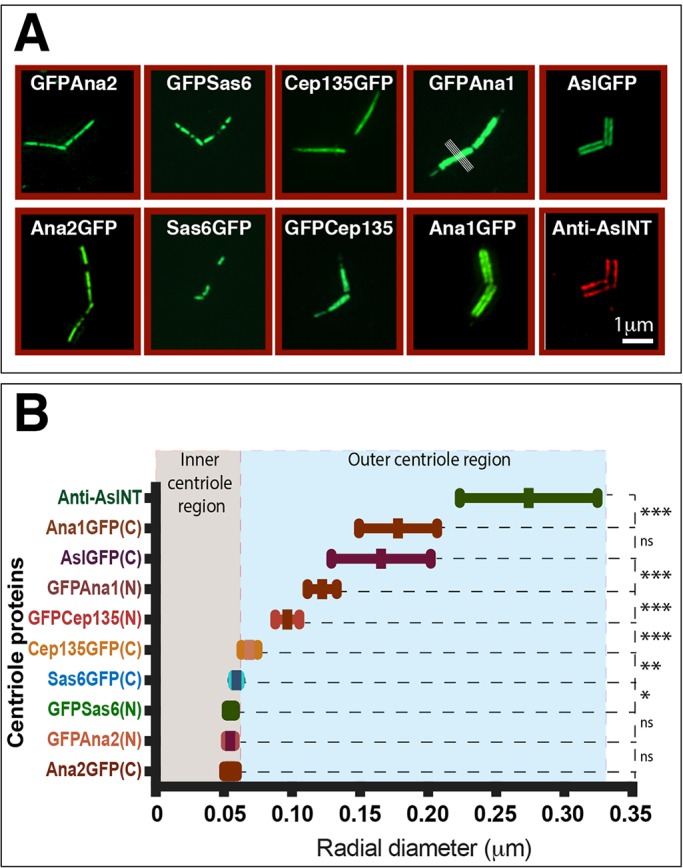
Ana1, Cep135 and Asl molecules are oriented within spermatocyte centrioles. (A) Micrographs showing 3D-SIM images of centrioles in primary spermatocytes expressing various centriole proteins tagged with GFP at either their N- or C-termini and stained for GFP (green). The bottom-right image shows a centriole stained with anti-Asl-NT antibodies (red). The white lines in the GFPAna1 panel indicate example lines drawn through the centriole to calculate a fluorescence intensity distribution. (B) Graph showing the mean±s.d. radial diameter of each centriole marker (as indicated, see Materials and Methods) (n=10–53 centrioles). Statistical significance of the different radial diameters between successive proteins – moving from the innermost (Ana2–GFP) to the outermost (Asl-NT) – was calculated using a paired two-tailed t-test. *P<0.05; **P<0.001; ***P<0.0001; ns, not significant. Note that the radial diameters of the N-terminal region of Cep135 and the N-terminal region of Ana1 – which can directly interact with one another in vitro – are significantly different.