Fig. 1.
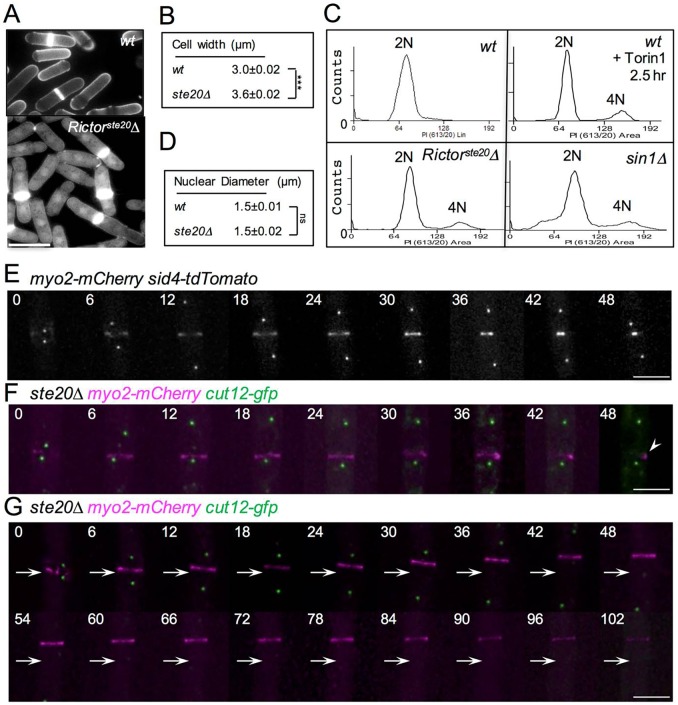
TORC2-deficient mutants display defects in cytokinesis and cell fission. (A) Early exponential wild-type (wt) and Rictorste20Δ (ste20Δ) prototroph cells were stained with Calcofluor to visualise the division septa. Scale bar: 10 µm. These cells, as well as sin1Δ cells and cells treated with Torin1, were (C) processed for flow cytometry analysis to measure DNA content. Mean cell width (B) and nuclear diameter (D) were each determined from counting 300 wild-type and Rictorste20Δ cells in mid-log culture. ***P<0.001, ns, not significant (Student's t-test). (E) A montage of time-lapse images showing red fluorescence from myo2–mCherry sid4–tdTomato cells undergoing cell division. Cells illustrating timing of CAR formation and constriction in relation to SPB segregation in wild-type cells are shown. (F,G) Equivalent montages of time-lapse images of mCherry (magenta) and GFP (green) fluorescene from myo2–mCherry cut12–gfp Rictorste20Δ cells. In a large proportion of anaphase Rictorste20Δ cells the CAR was seen to either collapse (arrowhead, F) or drift along the cortex towards one end of the cell (arrows, G). Scale bars: 5 µm.

