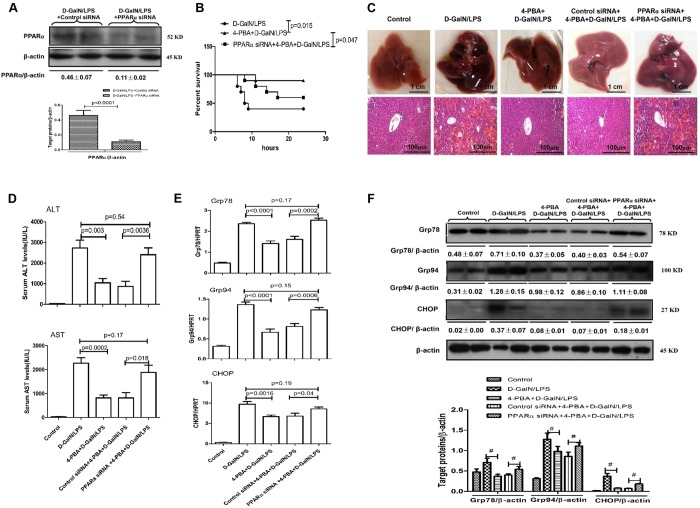
Fig. 4.
4-PBA protects against D-GalN/LPS-induced ALF in mice by promoting PPARα activation. Mice were pre-treated with PPARα siRNA (50 μM/kg) or control siRNA (50 μM/kg) via tail vein injection and then further injected with 4-PBA (100 mg/kg) or PBS, 24 h and 6 h prior to D-GalN (700 mg/kg) and LPS (10 μg/kg) treatment (n=14/group), respectively. The control mice were injected with only PBS (n=10). One group of mice were euthanized 6 h after D-GalN/LPS treatment, and the liver and serum samples were collected. (A) Protein levels of PPARα and β-actin were measured by western blotting in the control siRNA/D-GalN/LPS-treated mice and the PPARα siRNA/D-GalN/LPS-treated mice. A representative blot from two samples of every group is shown. Densitometry analysis of protein levels was performed for each sample. (B) In a second group of mice, the survival rate was analyzed in D-GalN/LPS-treated mice, 4-PBA/D-GalN/LPS-treated mice and PPARα siRNA/4-PBA/D-GalN/LPS-treated mice up to 24 h after D-GalN/LPS injection. (n=10/group). (C) Representative livers and H&E staining of liver sections from control mice, D-GalN/LPS-treated mice, 4-PBA/D-GalN/LPS-treated mice, control siRNA/4-PBA/D-GalN/LPS-treated mice, and PPARα siRNA/4-PBA/D-GalN/LPS-treated mice. (D) Serum levels of ALT and AST from the five treatment groups described in C. (E) Relative hepatic mRNA expression levels of ER stress markers Grp78, Grp94 and CHOP in the five treatment groups were measured by qRT-PCR. (F) Protein levels of Grp78, Grp94, CHOP and β-actin in the five treatment groups were measured by western blotting. A representative blot from two samples of every group is shown. Densitometry analysis of protein levels was performed for each sample (#P<0.05). Data in A,D-F represented as means±s.d.

