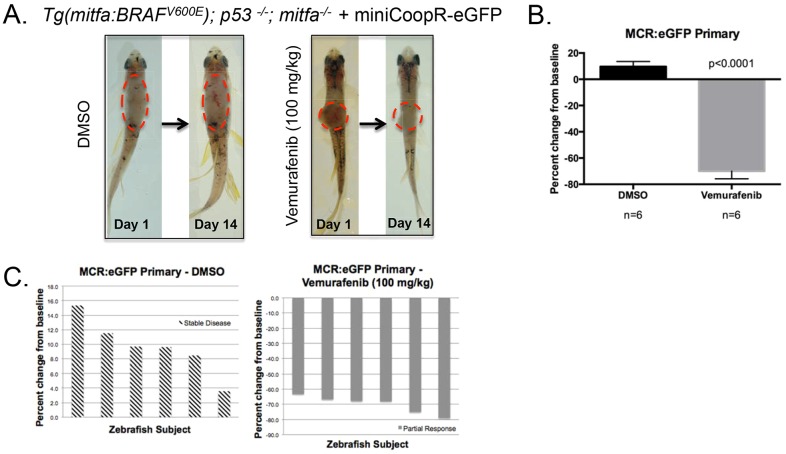
Fig. 5.
BRAFV600E inhibitor treatment of primary zebrafish melanoma tumors. (A) On the left, a representative MCR:eGFP zebrafish with primary tumors along its dorsal side was treated with DMSO control for 2 weeks via oral gavage. On the right, a representative MCR:eGFP zebrafish with primary tumors along its dorsal side was treated with 100 mg/kg Vemurafenib for 2 weeks via oral gavage. The fixed dotted red line represents the tumor area pre-treatment. (B) Average percent change from baseline of tumor area based on pigmentation in a cohort with n=6 in the both the DMSO- or Vemurafenib-treated arm. Two-tailed paired t-test was performed for statistical analysis. Data represented as mean±s.d. of three replicates. (C) Waterfall plots depict the range of response for the experimental cohorts, DMSO and Vemurafenib. The response was quantified by percent change of tumor area from baseline.

