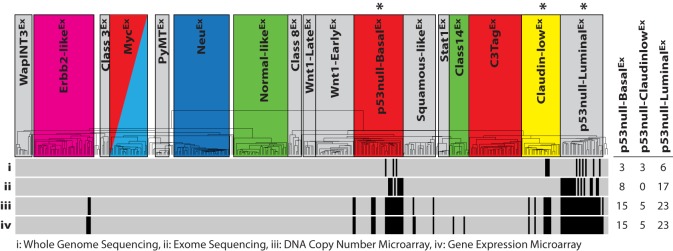
Fig. 2.
Murine Trp53-null tumor datasets. Sequencing and microarray technologies were used to produce four Trp53-null tumor datasets of varying sizes: (i) whole genome sequencing (n=12), (ii) exome sequencing (n=25), (iii) DNA copy-number microarray (n=43) and (iv) gene expression microarray (n=43). The intrinsic class of each sample is displayed on the dendrogram, with colored boxes being previously identified human subtype counterparts (Pfefferle et al., 2013). The hierarchical clustering location of each p53-null tumor within the datasets is displayed as a vertical black strip. *The Trp53-null transplant model produces heterogeneous tumors that primarily develop into one of these three murine expression subtypes. For each dataset, the number of tumors studied from each of the three murine classes highlighted by ‘*’ is displayed on the right-hand side of the figure.

