Fig. 3.
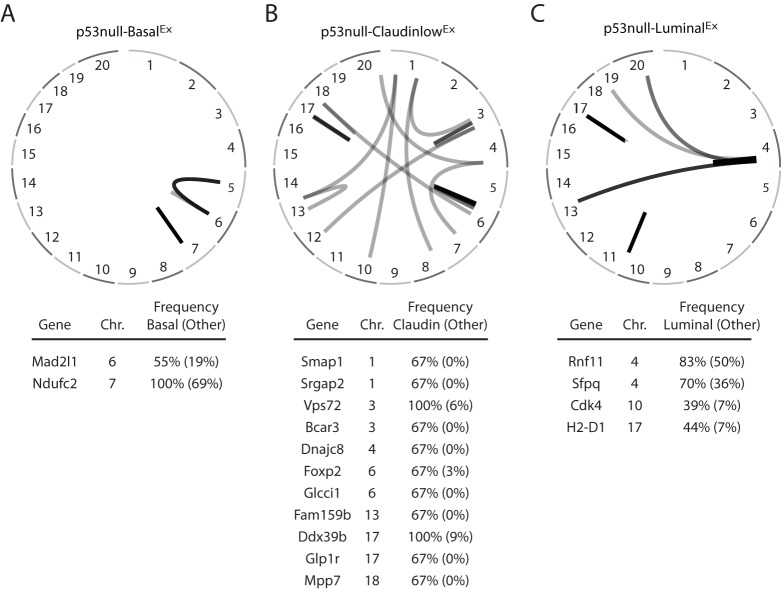
Chromosome structural-variation analysis. Displayed are circos plots of the structural variants (SVs) enriched within (A) p53null-BasalEx, (B) p53null-Claudin-lowEx and (C) p53null-LuminalEx tumors as determined by a two-class (class x versus all others) Fisher's exact test. The genes affected by these SVs are listed under each circos plot.

