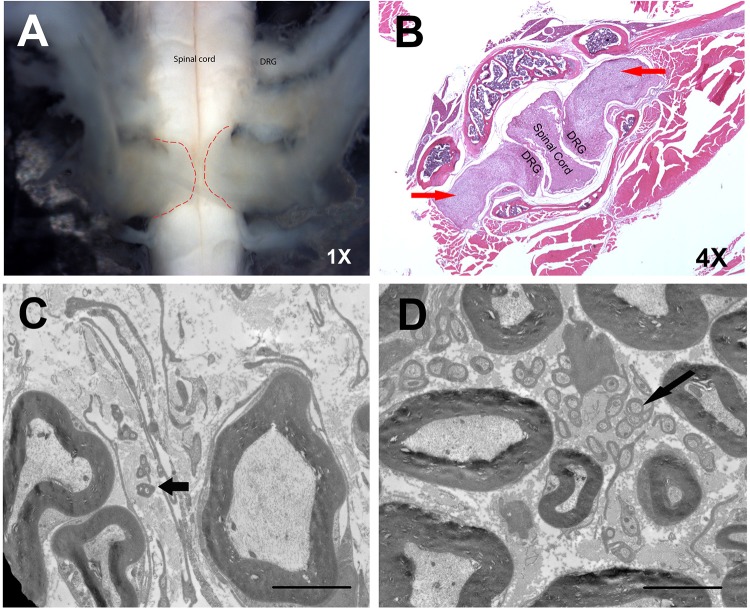
Fig. 3.
Nf14F/4F; DhhCre mice develop neurofibromas and sciatic nerve lesions. (A,B) Gross dissection (A) and H&E staining (B) of spinal tumors in Nf14F/4F; DhhCre mice. Red dashed lines demarcate the neurofibroma boundaries. Red arrows indicate neurofibromas. (C,D) The ultrastructure, as shown by electron microscopy, shows similar lesions in the Nf14F/Arg681*; DhhCre mice in both neurofibromas (C) and sciatic nerves (D). Black arrows indicate abnormal nonmyelinating axons. The magnifications are as indicated. Scale bars: 4 μm in C,D.

