Fig. 2.
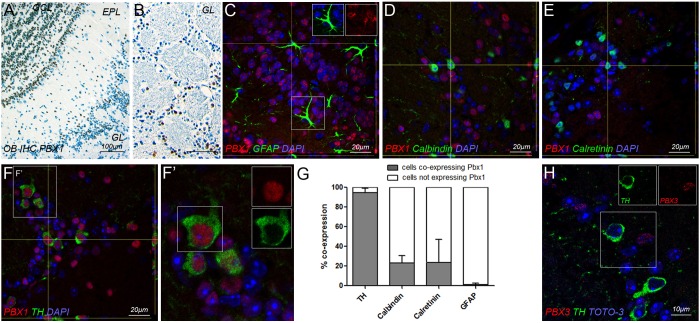
PBX localization in the OB. (A,B) PBX1 protein (brown) in the GCL and GL of the OB. (C-F′) Double labeling for PBX1 (red) and GFAP (green) in the GCL (C), and calbindin (D, green), calretinin (E, green) or TH (F, green) in the GL. Boxed areas are shown as single channels or at higher magnification. (G) Quantification of colocalization of PBX1 with GFAP, calbindin, calretinin or TH. Error bars indicate s.e.m. (n=4 hemispheres each). (H) PBX3 (red) was not detected in TH+ cells (green). EPL, external plexiform layer; GCL, granule cell layer; GL, glomerular layer; TH, tyrosine hydroxylase.

