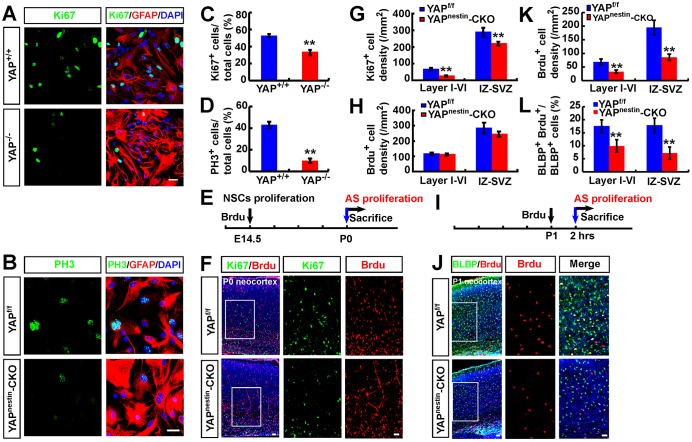
Fig. 4.
Reduced local proliferation of neocortical astrocytes in Yapnestin-CKO mice. (A,B) Double immunostaining analysis of (A) Ki67 (green) and GFAP (red) or (B) PH3 (green) and GFAP (red) in cultured astrocytes from P1 Yapf/f and Yapnestin-CKO mice. (C,D) Quantitative analysis of the percentage of Ki67+ (C, n=16 per group) and PH3+ (D, n=12 per group) astrocytes among total astrocytes. (E) Scheme of BrdU incorporation experiments in F. AS, astrocyte. (F) Double immunostaining analysis of Ki67 (green) and BrdU (red) in neocortex of P0 Yapf/f and Yapnestin-CKO mice (sagittal sections). (G,H) Quantitative analysis of (G) Ki67+ or (H) BrdU+ cell density in neocortex of P0 Yapf/f and Yapnestin-CKO mice (n=4 per group) as shown in F. (I) Scheme of BrdU incorporation experiments in J. (J) Double immunostaining analysis of BLBP (green) and BrdU (red) in neocortex of P1 Yapf/f and Yapnestin-CKO mice (sagittal sections). (K,L) Quantitative analysis of (K) BrdU+ cell density and (L) the percentage of BLBP+ and BrdU+ cells among total BLBP+ cells (n=10 per group) in neocortex of P1 Yapf/f and Yapnestin-CKO mice as shown in J. Boxed regions are shown at higher magnification. DAPI (blue) was used to stain nuclei. Data are mean±s.e.m. **P<0.01, compared with control group, Student's t-test. Scale bars: 20 μm.

