Fig. 5.
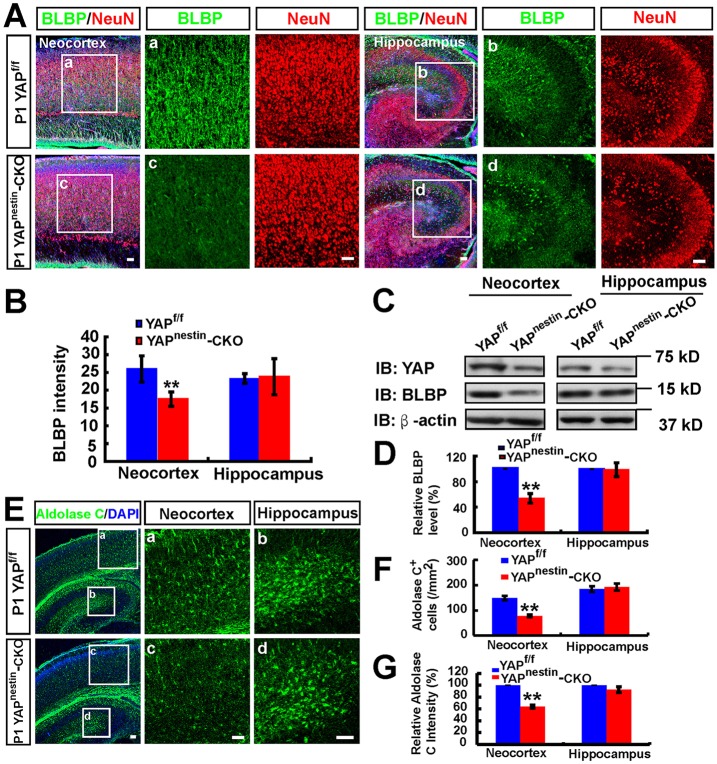
Reduced neocortical astrogliogenesis in Yapnestin-CKO mice. (A) Double immunostaining of BLBP (green) and NeuN (red) in neocortex and hippocampus of P1 Yapf/f and Yapnestin-CKO mice (sagittal sections). (B) Quantitative analysis of BLBP (n=18 for neocortex per group, and n=5 for hippocampus per group) fluorescence intensity as shown in A. (C) Western blot analysis of BLBP expression in neocortex and hippocampus of P1 Yapf/f and Yapnestin-CKO mice. (D) Quantitative analysis of western blot data as shown in C (n=3 per group, normalized to WT). (E) Immunostaining of aldolase C (green) in neocortex and hippocampus of P1 Yapf/f and Yapnestin-CKO mice. (F,G) Quantitative analysis of (F) the density of aldolase C+ cells and (G) the relative aldolase C fluorescence intensity (n=8 per group, normalized to WT) as shown in E. Selected regions in Yapf/f (a,b) and Yapnestin-CKO (c,d) mice are shown at higher magnification. Data are mean±s.e.m. **P<0.01, compared with control group, Student's t-test. Scale bars: 20 μm.

