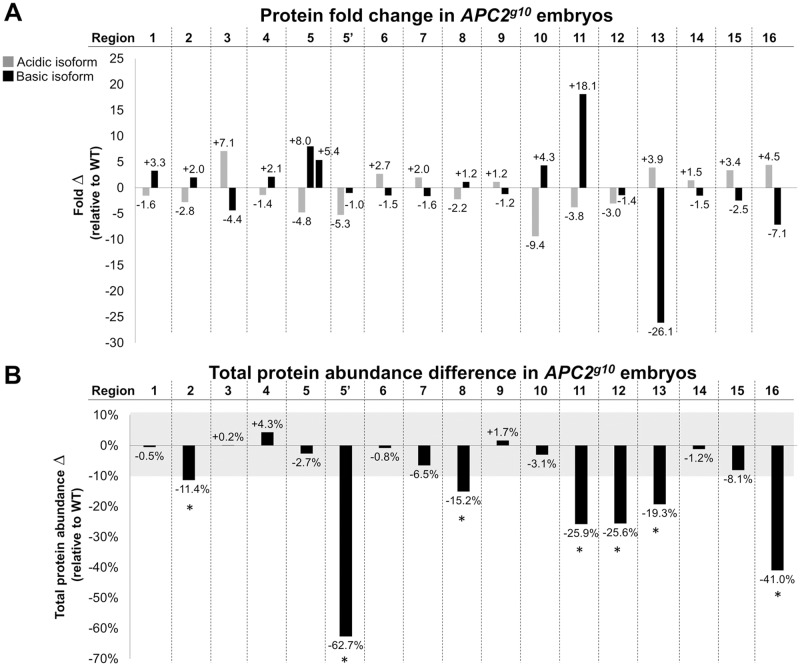
Fig. 3.
Quantification of Apc2-dependent difference-proteins. (A) The fold change for each difference-protein pair as calculated using the Cy3 and Cy5 raw fluorescence intensities. Cy3/Cy5 ratios <1 were converted to negative fold change. (B) Total protein abundance, defined as the sum of the fluorescence intensities of putative difference-protein isoforms, was calculated for each protein region in wild-type and Apc2g10 embryos. The percentage difference in total protein isoform fluorescence relative to wild type was then calculated. Difference-proteins that display a >10% change in total abundance are marked with an asterisk.

