
Fig. 1.
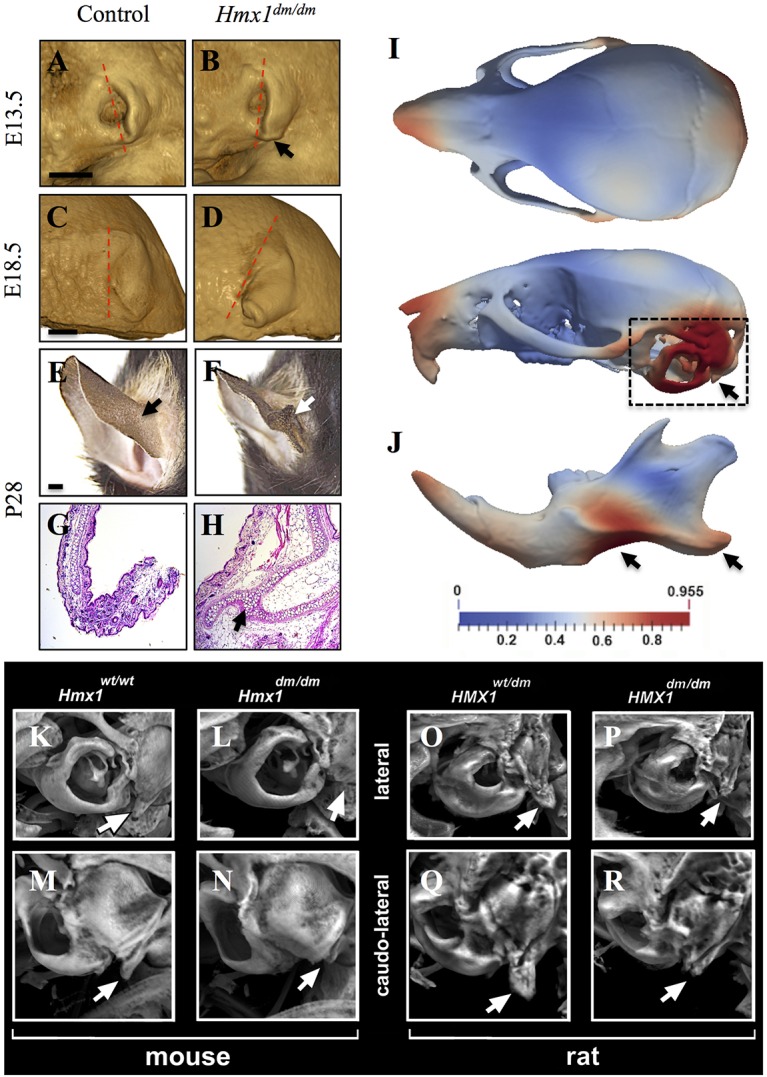
Characterization of craniofacial defects and shape changes in Hmx1dm/dm mutant animals. (A-D) OPT imaging of E13.5 (A,B; control n=4, Hmx1dm/dm mutant n=5) and E18.5 (C,D; control n=2, Hmx1dm/dm mutant n=2) control (A,C) and Hmx1dm/dm mutant (B,D) embryos show morphological differences in the external ear (arrow). The most commonly observed pinna morphologies are displayed. Dashed line indicates pinna orientation. (E-H) Representative posterior view (E,F) and Hematoxylin & Eosin-stained sections (G,H) through a P28 control (E,G) and Hmx1dm/dm mutant (F,H) ear highlight the malformation present in Hmx1dm/dm mutant mice (E,F,H, arrows; control n=28, Hmx1dm/dm mutant n=17). (I,J) Deformational analysis of P28 Hmx1dm/dm skulls and mandibles. Heat maps are projected onto a standard control skull and highlight the relative mean shape differences (control n=24, Hmx1dm/dm n=17). Dashed box and arrows highlight the highest magnitude of shape differences present in the skull (I) and mandible (J) of Hmx1dm/dm animals. (K-R) MicroCT analysis of control (K,M) and Hmx1dm/dm mutant (L,N) mouse skulls and heterozygote (O,Q) and homozygote (P,R) dumbo rat skulls. Marked hypoplasia of the paraoccipital process is evident in Hmx1dm/dm mutant mice and rats (compare K with L, and O with P, arrows for lateral view; compare M with N, and Q with R, arrows for caudo-lateral view). Control Hmx1+/+ mice (n=28) and Hmx1dm/dm mutant mice (n=17). Hmx1dm/+ rats (n=2) and Hmx1dm/dm mutant (n=2). Scale bars: 1 mm (A-F).