Fig. 6.
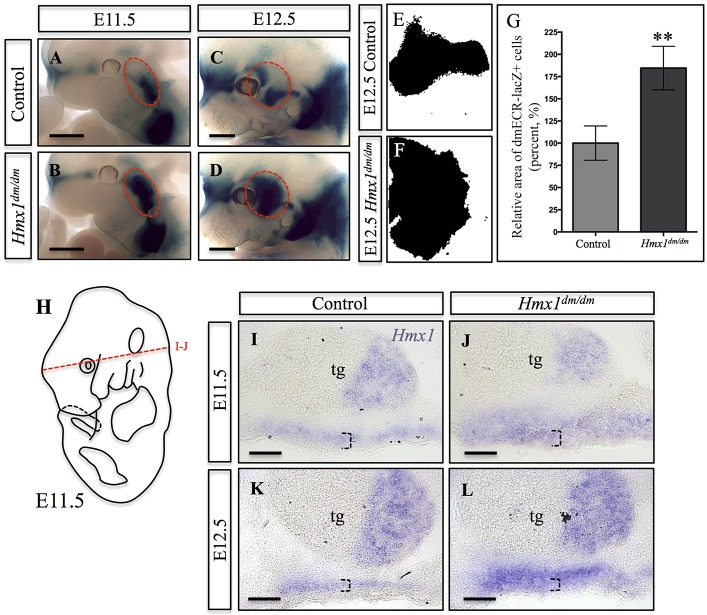
dmECR enhancer activity and Hmx1 expression are expanded in Hmx1dm/dm mutants. (A-D) dmECR staining in control (A,C) and Hmx1dm/dm mutant (B,D) embryos at E11.5 (A,B; control n=5, Hmx1dm/dm mutant n=7) and E12.5 (C,D; control n=4, Hmx1dm/dm mutant n=4) shows an expansion of the dmECR staining pattern in Hmx1dm/dm mutants (red dashed circle). (E,F) Representative binary particle area diagrams from ImageJ displaying dmECR-lacZ+ cells present in the E12.5 face of controls (E) and Hmx1dm/dm mutant (F) embryos. (G) Quantification of the area displayed in E and F for E12.5 controls (n=4) and Hmx1dm/dm mutant (n=4) embryos (plotted values are the mean±s.e.m., **P=0.0016). (H) Diagram of an E11.5 mouse embryo highlighting the transverse plane displayed in I and J. (I-L) Hmx1 in situ on control (I,K) and Hmx1dm/dm mutant (J,L) E11.5 (I,J; n=2) and E12.5 (K,L; n=2) transverse sections show an expansion of Hmx1 transcripts in Hmx1dm/dm mutants (compare I with J, and K with L, black dashed brackets). tg, trigeminal ganglion. Scale bars: 1 mm (A-D); 100 µm (I-L).

