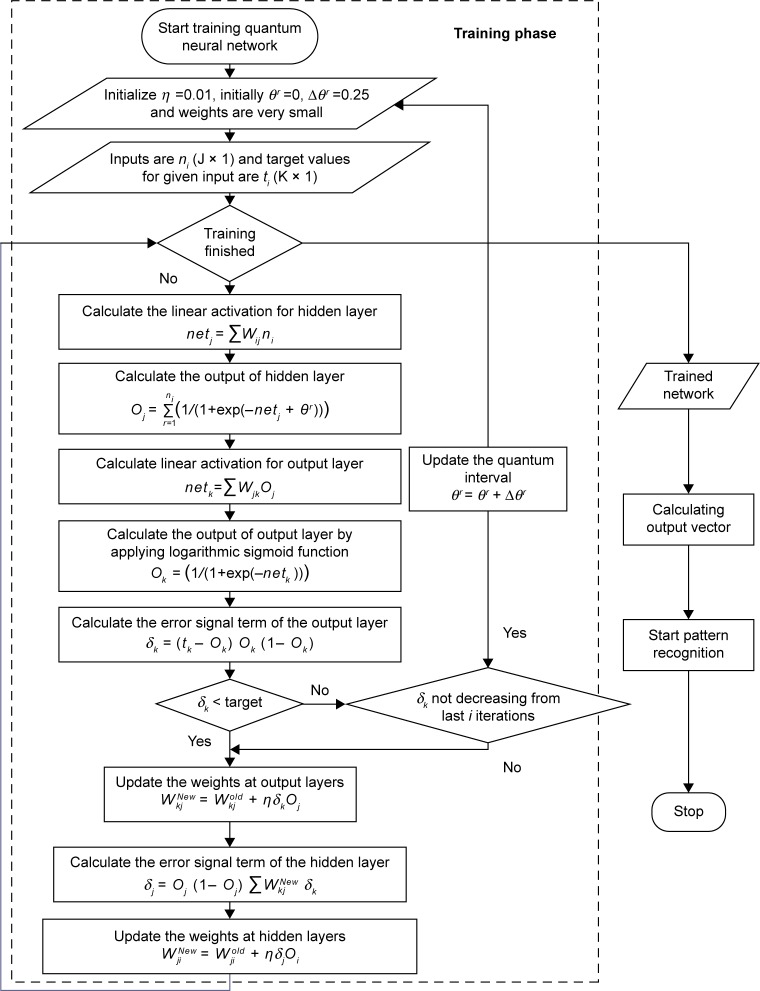
Figure 3.
Flowchart of quantum neural network for heart disease prediction system.
Notes: θr denotes quantum interval between sub-states, with the difference of quantum level r. ns denotes the number of grades or excitation levels, η is learning rate, δk is error rate of output layer, and δj error rate of hidden layer. ni denotes the input to the input layer. Oj and Ok denote the output of hidden and output layer, respectively. The weights between input and hidden layers are denoted by Wij and the weights between hidden and output layers are denoted by Wkj. t denotes target value.

