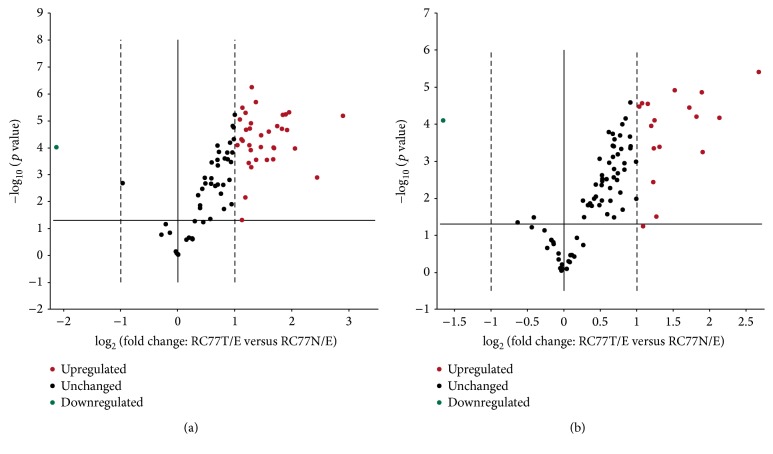
Figure 1.
Volcano plots of the mitochondria real-time PCR array results. The continuous vertical line indicates a 1.0-fold change in gene expression. The dotted vertical lines indicate the desired threshold of a 2.0-fold change in gene expression. The horizontal continuous line indicates the desired 0.05 threshold for the p value of the t-test. (a) represents the Human Mitochondria array and (b) represents the mitochondria bioenergetics array.

