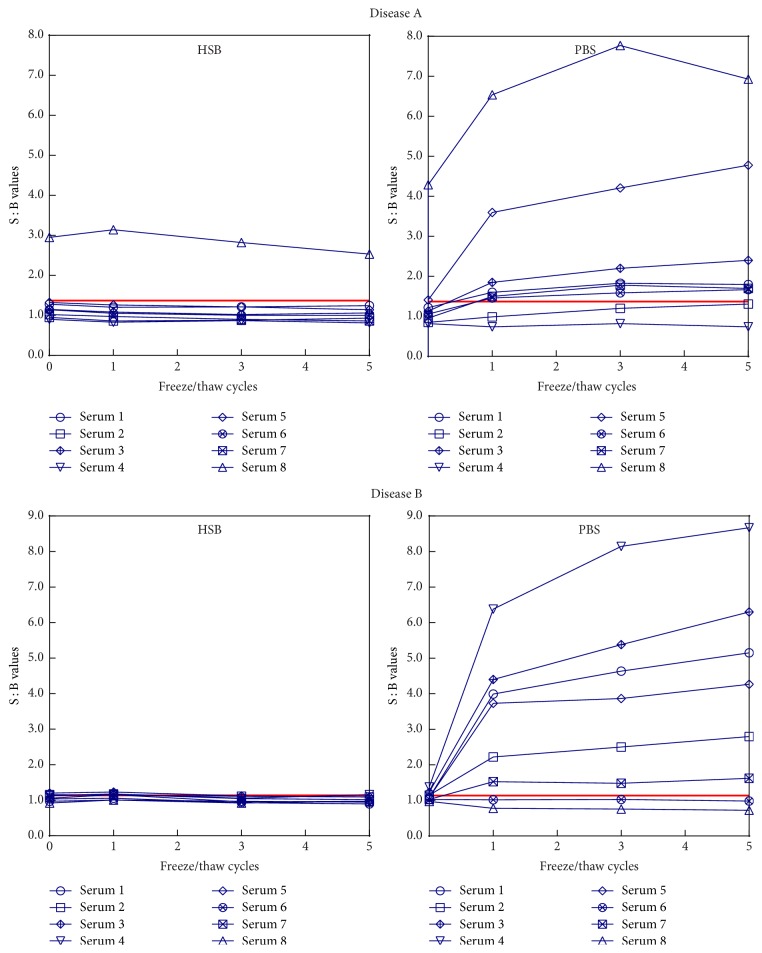
Figure 2.
Screening responses of individual disease A and disease B serum samples tested using ruthenylated antibody reagents stored in PBS and in HSB. The solid red line on each graph indicates screening cut point values for disease A (1.37) and disease B (1.14) populations obtained during method validation.

