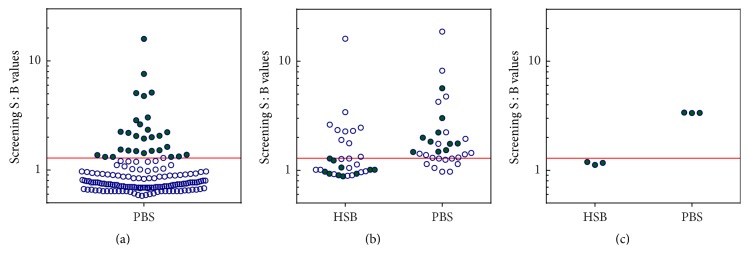
Figure 4.
Preparation of the reagent monitoring control. (a) 160 commercial serum samples from drug-naïve subjects diagnosed with disease B were screened using conjugated reagents stored in PBS and subjected to one freeze/thaw cycle. Solid green circles indicate samples with S : B responses at or above the screening cut point. (b) Samples selected in step (a) were tested in the screening assay using conjugated reagents stored in PBS and in HSB. Solid green circles indicate samples that changed classification from negative when tested using reagents in HSB to positive using reagents in PBS. (c) Samples identified in step (b) were pooled together and measured three times using conjugated reagents stored in HSB and using reagents in PBS. Green circles in this panel represent the three separate measurements of the final RMC pool. Red line indicates assay cut point for disease B.

