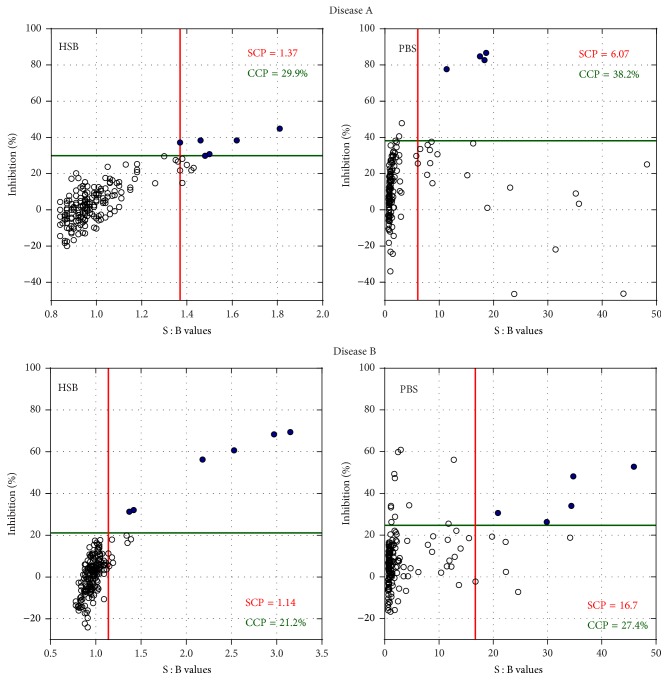
Figure 5.
Screening and confirmatory responses of individual drug-naïve disease A and disease B samples tested using conjugated reagents stored in HSB or in PBS. The vertical red and horizontal green lines on each graph show screening (SCP) and confirmatory cut points (CCP), respectively. Open circles (○) indicate negative responses and closed circles (●) correspond to confirmed positives.

