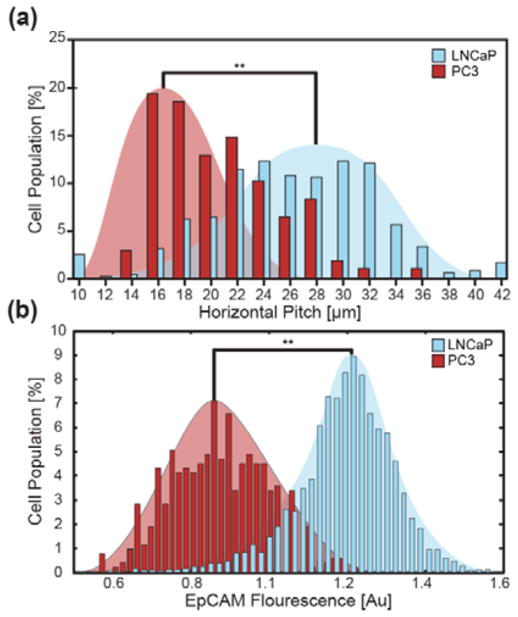
Figure 4.
Ratcheting cytometry of PC3 and LNCaP cells showed differential population distributions consistent with flow cytometry analysis. (a) PC3 cells demonstrate lower EpCAM expression and therefore equilibrate at lower critical pitches when ratcheted at 5Hz on a 2μm incremented chip compared to the LNCaP cells. (b) Flow cytometry analysis shows a similar trend in differential expression between the PC3 and LNCaP cell populations.

