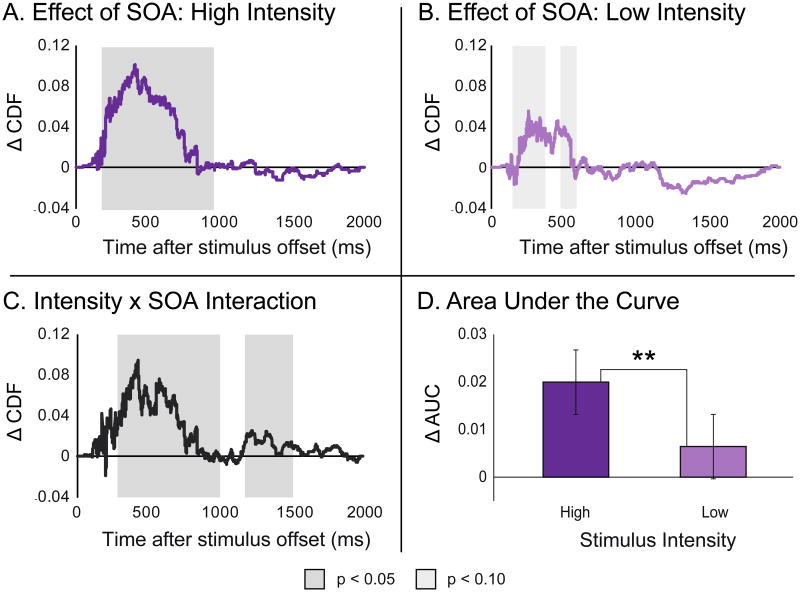
Figure 3.
A and B – Differences in cumulative distribution functions measured with synchronous (0 ms SOA) and asynchronous (200 ms SOA) presentations with both high-intensity (Panel A) and low-intensity (Panel B) presentations. C – An interaction between SOA and stimulus intensity was observed using a difference-of-difference measure. The effect of SOA was significantly more pronounced with high- than with low-intensity stimuli. D – Area-under-the-curve measures were extracted from the CDF differences displayed in Panels A and B, providing a secondary measure of interactions between SOA and stimulus intensity. ** denotes a significant difference at an α-level of 0.05.

