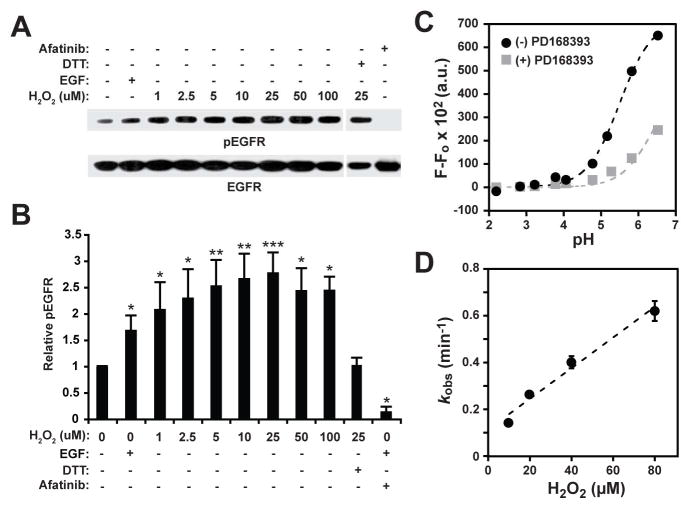
FIGURE 2.
H2O2 stimulation of EGFR autophosphorylation and biochemical properties of C797. (A) Full length native EGFR was treated with EGF (3.3 ng/μl) or H2O2 (0–100 μM). Western blot shows autophosphorylated (p) and total EGFR. (B) Densitometric quantification of A. Data are normalized to untreated control and are representative of three independent readings (mean ± s.e.m). *p<0.05, **p<0.01, ***p< 0.001 compared to untreated control. (C) Bromobimane fluorescence labeling of recombinant EGFR over a pH range (2–6.5) yields a single pKa value for C797 of 5.5 ± 0.1. Data are representative of two independent readings. (D) Plotting the rate of sulfenic acid formation over a range of H2O2 concentrations (10, 20, 40, 80 μM) yields a second-order rate constant for the H2O2 reactivity of C797 of ≥110 M−1s−1. Data represent the average of two independent readings (mean ± s.e.m.).

