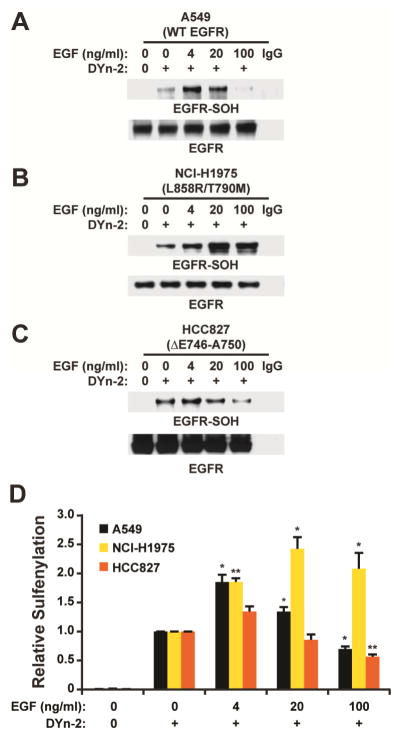
FIGURE 5.
Sulfenylation profiles of oncogenic EGFR mutations. (A–C) Western blots show sulfenylated and total EGFR. Lung cancer cells expressing wild type (A) A549 (WT) or EGFR mutants (B) NCI-H1975 (L858R/T790M) and (C) HCC827 (ΔE746-A750) were stimulated with EGF or vehicle for 2 min and sulfenic acids were detected by Strep-HRP western blot. (D) Densitometric quantification of A–C. Data are normalized to untreated control for each respective cell line and representative of three independent readings (mean ± s.e.m). *p<0.05, **p <0.01, ***p<0.001 compared to the untreated control for each cell line.

