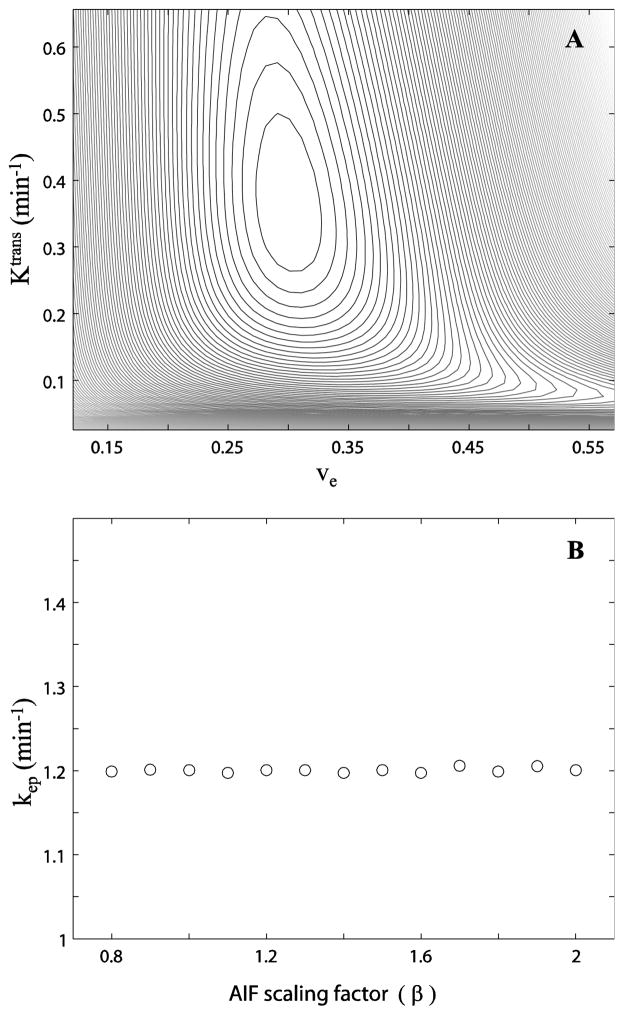
Figure 2.
Figure 2A shows a Ktrans vs. ve error surface. The contour plot shows the chi square statistic, χ2 = Σ[Sref(t) – Sgrid(t)]2, for simulated DCE-MRI time-courses from parameters equal to the Ktrans,ve coordinates. The χ2 value decreases as the contour lines move towards the center of the closed loops. B shows the best kep (≡Ktrans/ve) values determined at different β values. A near constant kep is observed within the entire β range tested.

